Our NEOs participate in Barrick’s Partnership Plan, which provides eligibility for the Annual Performance Incentive (API) Program, the PGSU Plan, and the Partner Change in Control Severance Plan (Change in Control Plan). Our NEOs are also subject to market-leading share ownership requirements, which reflects a deep commitment to long-term ownership at the heart of our partnership culture.
2024 Named Executive Officers
This Circular reports the compensation paid to our NEOs in 2024:
| D. Mark Bristow |
President and Chief Executive Officer |
| Graham P. Shuttleworth |
Senior Executive Vice-President, Chief Financial Officer |
| Kevin J. Thomson |
Senior Executive Vice-President, Strategic Matters |
| Mark F. Hill |
Chief Operating Officer, Latin America and Asia Pacific |
| Sebastiaan Bock |
Chief Operating Officer, Africa and Middle East |
Why Should Shareholders Approve Our Say on Pay?
Barrick’s executive compensation framework is an integral part of the Company’s strategy and our employee value proposition. Our distinctive executive compensation framework is uniquely tailored to support our partnership culture and was designed with input gained from extensive annual consultation with our shareholders since 2014.
We have continued to evolve our executive compensation framework since the Merger to ensure we reward growth and the strategic foundations required to build a long-term sustainable business. Our executive compensation program aligns our incentive compensation outcomes with short- and long-term performance and delivers a meaningful portion of overall pay in the long-term to reward a consistent management focus on long-term value creation. In line with our pay for performance philosophy, the performance measures for our API Program and Long-Term Company Scorecard were selected to drive our differentiated strategy. Our 2024 compensation decisions reflect our continued strategic progress, sustainability achievements, compensation relative to prior years, and shareholder feedback, including the results of our 2024 advisory Say on Pay vote of 72.4% and feedback received from discussions throughout 2024 with significant shareholders representing approximately 34% of the issued and outstanding Barrick Shares (as of December 31, 2024).
| What we heard |
2024 compensation decisions |
| The individual components of the API Scorecards are weighted too heavily, and a greater emphasis should be placed on quantifiable, company-wide measures |
- Commitment to reduce weighting of the individual component from 70% to 30% by 2025. Individual component was reduced to 50% in 2024 as a transitionary step
- Commitment to increase weighting of company-wide measures from 30% to 70% by 2025. Company-wide performance will be assessed based on ESG, Production, and Cost measures, which is aligned with the short-term incentive scorecard measures applicable to eligible individuals who do not participate in Barrick’s Partnership Plan
|
| There needs to be greater transparency on how fatalities are factored into pay outcomes |
- Nothing is more important to us than the health, safety, and well-being of our people. Our safety performance is holistically assessed through our API and LTI Scorecards, with measures including TRIFR, zero fatalities, and progress against our Journey to Zero Roadmap to injury free workdays
- In 2024, we increased the Safety weighting from 5% to 10% in the API Scorecard, with 5% based on LTIFR and the remaining 5% to be paid out only if there are no fatalities. There was no payout for the fatalities component in 2024. The Safety weighting remains under review for 2025
- The Sustainability Scorecard, which accounts for 20% of the overall Long-Term Company Scorecard, includes a “Zero Fatalities” measure, with zero achievement in 2024 due to the 3 fatalities recorded. Despite our notable progress towards achieving our sustainability vision, the overall Sustainability Scorecard result was adjusted from 100% (for Grade A achievement) to 80% in light of the fatalities recorded over the past three years
|
| Pay should be better aligned to the shareholder experience |
- 100% of all incentive compensation is tied to performance, with 35% directly tied to our relative TSR performance since 2023
- Since 2019, we have returned $5.9 billion to shareholders in the form of dividends, returns of capital, and share buybacks. Total NEO compensation was $218.4 million over the same period (3.7% of the aggregate amount returned to shareholders)
- 2024 total NEO compensation decreased by 23% from 2019 levels, compared to a TSR of -4.5% on the NYSE over the same period
- We are a Company of Owners who are financially invested in Barrick’s success, which is reflected in the breadth and depth of share ownership across the Company. As of March 1, 2025, NEOs (including the President and Chief Executive Officer) held over 8.1 million Barrick Shares worth more than $144 million, and the Board (excluding the President and Chief Executive Officer) held over 2.8 million Barrick Shares worth more than $49 million
|
Base Salary
Base salaries are determined based on the scope of individual responsibilities, skills, and performance. The Compensation Committee annually reviews the base salaries of our NEOs to ensure they remain competitive relative to roles of similar size and scope of responsibilities.
A review of base salaries was conducted in 2024, which considered internal equity and market competitiveness in the context of our increasingly international executive team. Following this review, the President and Chief Executive Officer recommended, and the Compensation Committee approved, an increase in the base salary for our Chief Operating Officer, Africa and Middle East to $550,000 per annum effective January 1, 2024. Effective January 1, 2025, his salary increased to $575,000 per annum.
There were no base salary adjustments for any other NEOs.
Annual Performance Incentive Program
The API Program is a key component of our Partnership Plan, originally designed in 2014 to incentivize a strong individual focus on the execution of our strategic priorities. For our Partners (including our NEOs), the maximum API opportunity is capped at 150% - 300% of base salary (depending on role). API payouts are generally delivered in cash, unless otherwise determined by the Compensation Committee. Consistent with our pay-for-performance philosophy, there are no API awards for below threshold performance and maximum API awards will only be made in cases of demonstrably superior performance across all performance categories.
The API Scorecards were redesigned in 2023 to reinforce a shared responsibility for meeting our production, cost, safety, and environmental targets, including for our Journey to Zero focus. Performance measures include ESG, Production, and Costs, consistent with those included in the short-term incentive scorecard measures applicable to the rest of the organization, as well as individually tailored measures reflecting strategic and operational commitments. Performance for these measures is assessed at the Company level, or in the case of the Regional COOs, at the Company and regional levels (weighted equally as relevant) to reinforce line of sight to performance.
In 2024, the Compensation Committee continued to refine the API Program to build upon the reforms adopted in 2023 and further enhance the link between pay and performance based on pre-established, objective, and measurable goals, including a greater emphasis on our safety performance. This ongoing process considered the relative weighting between Company and individual measures on compensation outcomes, the practices of our Global Peer Group, and shareholder feedback. Following this review, and in recognition of feedback from shareholders, the Compensation Committee approved a two-step reduction to the weighting of the individual component (tied to tailored Strategic Priorities) from 70% to 30% by 2025, with a reduction to 50% in 2024 as a transitionary step. Accordingly, for 2024, the weighting of the company-wide performance component (ESG, Production, and Costs) was commensurately increased from 30% in 2023 to 50% in 2024, and will be further increased to 70% in 2025. In addition, the Safety weighting was increased from 5% to 10% in 2024 to further drive our Journey to Zero focus. See “2024 Performance Considerations for NEOs – 2024 Annual Performance Incentive Considerations” for an overview of the 2024 API Scorecard applicable to the NEOs.
The Compensation Committee believes this enhanced API performance framework maintains a strong focus on the deliberate execution of our Strategic Priorities linked to our annual business plan and reinforces a collective focus on Company and regional performance against operational key performance indicators. The Compensation Committee also believes that the introduction of Company-wide and regional measures meaningfully recognizes shareholders’ views while maintaining the focus on individual contributions and our short-term strategic objectives, and enhances the alignment of API payouts with Company performance.
We review our business plan at the beginning of each year to develop target performance ranges. The 2024 targets and ranges for the ESG, Production, and Cost measures, consistent with those applied to the rest of the organization, were approved by the Compensation Committee. Strategic Priorities for our NEOs, other than the President and Chief Executive Officer, were developed in consultation with the President and Chief Executive Officer to reflect individual scope and accountability. Strategic Priorities for the President and Chief Executive Officer were developed in consultation with the Chairman and the Lead Director.
Performance against the Strategic Priorities measures for our NEOs, other than the President and Chief Executive Officer, was holistically evaluated by the President and Chief Executive Officer at the end of the year. Performance against the Strategic Priorities for the President and Chief Executive Officer was holistically evaluated by the Chairman, with input from the Lead Director. For the Strategic Initiatives component, an overall rating from zero to five was assigned to allow for performance-based differentiation. The rating was then converted to a percentage ranging from 0% (minimum) to 100% (maximum), which is multiplied by 50% of the API Opportunity for each of our NEOs to determine payouts. Performance for the ESG, Production, and Costs measures was reviewed by the Compensation Committee against the applicable performance ranges to determine payouts for the remaining 50% of the API Opportunity. Performance was linearly interpolated between threshold and maximum performance levels to determine payouts.
The Compensation Committee determined the 2024 API awards for our NEOs using the following payout formula:
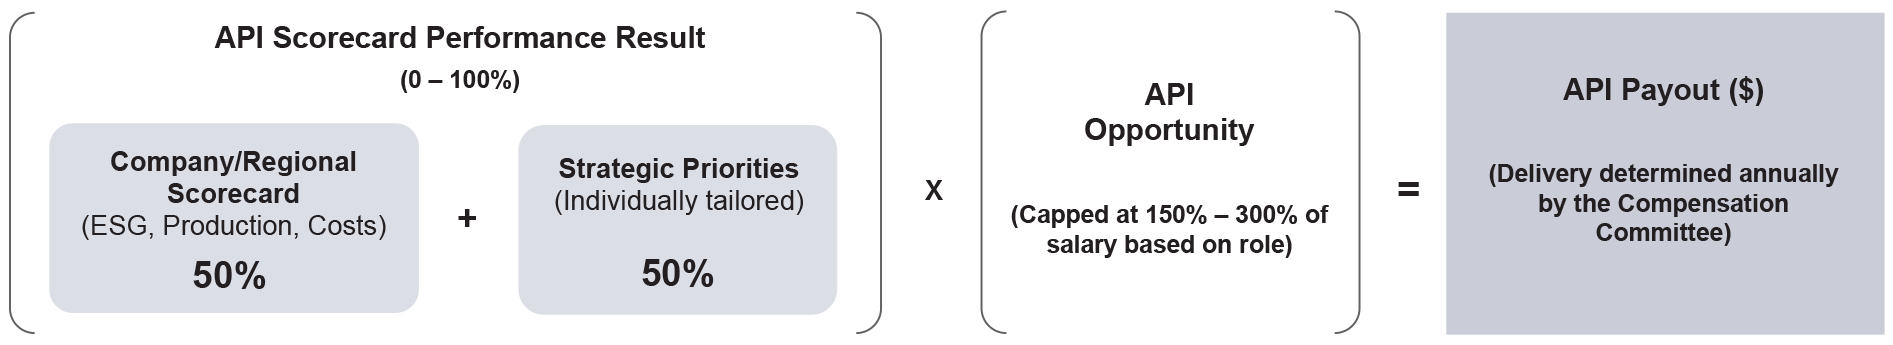
The payout formula is intended as a guideline, and the Compensation Committee has the discretion to approve and/or recommend to the independent directors of the Board a different payout from the value determined by the API Scorecards. The Compensation Committee may also make adjustments to the performance measures in each API Scorecard to reflect significant one-time items which occur during the performance period. Any such adjustments will be fully disclosed in our information circular each year. It is possible to receive no annual payout based on API Scorecard performance. API recommendations are considered by the Compensation Committee at the end of each year and decisions are generally made in February after the end of each year, once audited financial statements are approved by the Board.
See “2024 Performance Considerations for NEOs – 2024 Annual Performance Incentive Considerations” for detailed pay and performance highlights for our NEOs.
Performance Granted Share Units (PGSUs)
The cornerstone of our Partnership Plan is the innovative PGSU Plan, which was introduced in 2015 to ensure our NEOs and other Partnership Plan participants are financially and emotionally invested in Barrick’s long-term success. NEOs receive 100% of any annual LTI earned based on performance, in the form of PGSUs, which are share-based units that convert into Barrick Shares upon vesting. PGSUs, even after they convert to Barrick Shares, are subject to further holding requirements.
Each year, PGSUs are awarded based on the Compensation Committee’s multi-year assessment of the Company’s performance against our Long-Term Company Scorecard, which includes financial and non-financial metrics. These metrics were thoroughly reviewed in 2023, ahead of the fifth anniversary of Barrick’s transformational Merger with Randgold, to ensure alignment with the Company’s long-term strategy. The review also considered the drivers of our long-term growth, shareholder feedback, and how our peers define and measure long-term success.
We review the Long-Term Company Scorecard against our strategic plan and investor guidance to ensure that performance measures support the execution of our strategy. Target ranges for performance measures are reviewed annually and set based on stretch levels of performance that reflect Barrick’s life of mine plans and strategy, shareholder expectations, and the competitive environment. See “2024 Performance Considerations for NEOs – 2024 Long-Term Company Scorecard (for 2024 PGSU Awards)” for the results of the 2024 Long-Term Company Scorecard.
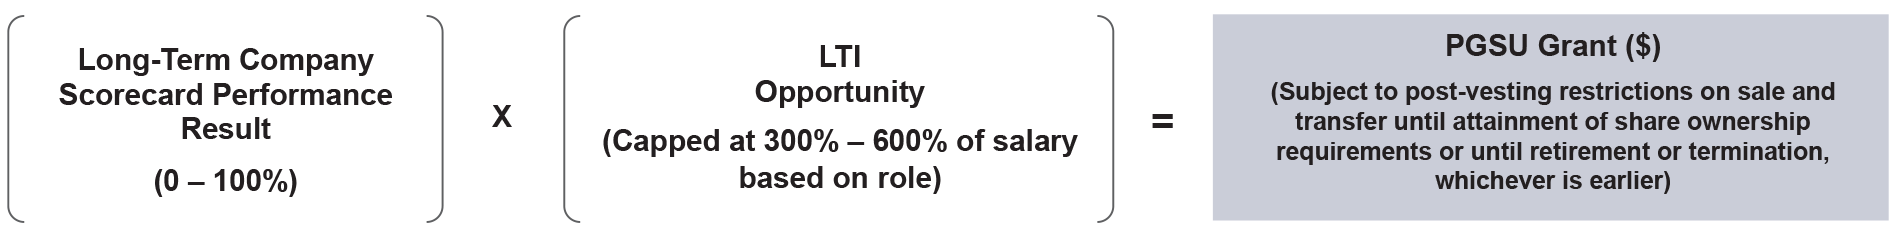
The Compensation Committee determined the 2024 PGSUs for our NEOs using the following payout formula. The payout formula is intended as a guideline, and the Compensation Committee has the discretion to approve and/or recommend to the Board that an NEO receive a different payout from the value determined by the Long-Term Company Scorecard. Maximum LTI awards will only be granted in cases of sustained long-term superior performance across all scorecard categories, and it is possible to receive no annual award of PGSUs based on Long-Term Company Scorecard performance.
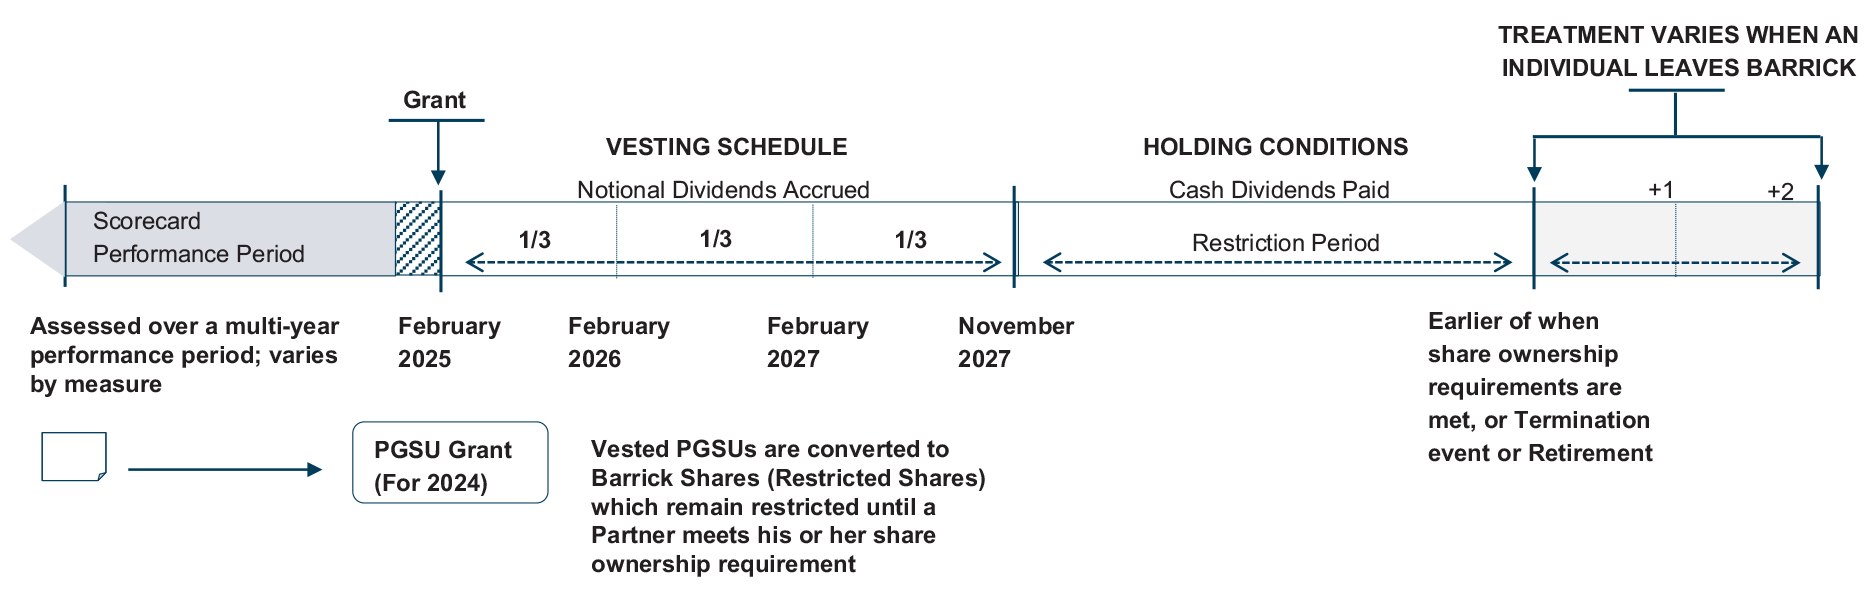
Illustrative Life Cycle of PGSUs
The following diagram illustrates the life cycle of PGSUs, from grant to payout, following termination of employment or retirement. PGSU awards granted in February 2025 in respect of 2024 were determined using the 2024 Long-Term Company Scorecard. PGSUs vest in one-third increments over 33 months. The key characteristics of the PGSU awards are included in Schedule C of this Circular. See “2024 Performance Considerations for NEOs – 2024 Long-Term Company Scorecard (for 2024 PGSU Awards)” for the results of the 2024 Long-Term Company Scorecard.
| Compensation Committee evaluates performance against Long-Term Company Scorecard |
Compensation Committee determines PGSU grants based on Long-Term Company Scorecard performance |
After PGSUs vest, Barrick Shares are purchased in the market by a third-party administrator on behalf of each Partner |
Partners can realize cash value from unvested PGSU awards or sale of Restricted Shares once restrictions lapse |
The Compensation Committee takes a multi-year lens when assessing Barrick’s performance against the Long-Term Company Scorecard to ensure that Partners are only rewarded for sustainable performance and shareholder value creation.
A three-year performance period applies for financial measures. Historical trending performance will be considered for other strategic measures.
Based on its assessment, the Compensation Committee assigns an overall score, which can range from 0% to 100%.
|
The Compensation Committee determines PGSU grants using the Long-Term Company Scorecard result.
The dollar value of each PGSU grant is determined by multiplying the Long-Term Company Scorecard result and the LTI Opportunity, which varies by Partner from three to six times base salary, depending on position and level of responsibility.
The number of PGSUs granted is determined by dividing the dollar value of the PGSU award, by the volume weighted average price (VWAP) of Barrick Shares for the five trading days prior to the grant date or, if the grant date occurs during a Blackout Period, the VWAP for the five trading days following the Blackout Period. |
PGSUs vest in one-third increments on the 12-month, 24-month, and 33-month anniversary of the date of grant (or, if the corresponding anniversary of the grant date falls during a Blackout Period, on the second trading day following the expiration of the Blackout Period).
The total number of PGSUs vesting would include the initial grant, plus dividends accrued during the vesting period. At vesting, the value of the PGSUs is equal to the closing price of Barrick Shares on the vesting date multiplied by the number of PGSUs having vested. The after-tax proceeds of the vested PGSUs are then used by a third-party administrative agent to purchase Barrick Shares on the open market, on behalf of the Partner.
Barrick Shares purchased upon the vesting of PGSUs (Restricted Shares) cannot be sold until the Partner meets his or her share ownership requirement (in which case only those Barrick Shares in excess of the requirement can be sold), or until the Partner retires or leaves the Company. Partners are required to retain at least 50% of their share ownership requirement in actual Barrick Shares. Partners receive dividends on their Restricted Shares in cash, when and as declared. |
Generally, when a Partner leaves the Company, all or a portion of unvested PGSUs will be forfeited except in the event of retirement at or above the age of 60, death or disability, or a double trigger Change in Control.
Restrictions on Restricted Shares will generally lapse and cease to apply when a Partner leaves the Company, provided that the Partner does not resign or retire from the Company to join, or provide services to, a defined competitor, or is not terminated for cause.
When a Partner resigns or retires from the Company to join, or provide services to, a defined competitor, or is terminated for cause, unvested PGSU awards will be forfeited and restrictions on Restricted Shares will lapse in three tranches (50% on termination or retirement and 25% on each of the first and second anniversary of termination or retirement). |
All PGSUs, including converted Barrick Shares upon vesting, are subject to Barrick’s Clawback Policy and Executive Officer Recovery Policy. See “Managing Compensation Risks – Clawback Policy and Executive Officer Recovery Policy” and “Managing Compensation Risks – NEO Share Ownership Requirements”.
Restricted Share Units
RSUs may be awarded to newly-hired officers in recognition of forfeited compensation upon joining Barrick or may be granted from time to time in recognition of a promotion, long-term retention, or other needs as deemed appropriate by the Compensation Committee. RSUs vest up to three years from the date of grant (as specified by the Compensation Committee at the time of the grant) and are settled in After-Tax Shares unless otherwise determined by the Compensation Committee. RSUs are granted on a case-by-case basis.
In 2018, the RSU Plan was amended and renamed the Long-Term Incentive Plan. Among other things, the Long-Term Incentive Plan provides the Compensation Committee with the flexibility to grant LTI in the form of After-Tax Shares. The key characteristics of unvested RSU awards are described in Schedule D of the Circular.
Previous Compensation Policies and Arrangements that Continue to Apply
Stock Options and Deferred Cash Awards
We no longer grant stock options or deferred cash awards (including cash-settled RSUs) for executive compensation purposes, to further underscore long-term ownership as the basis of our LTI awards. None of the NEOs have outstanding stock options.
Restructured Retention Award for the President and Chief Executive Officer and the Senior Executive Vice-President, Chief Financial Officer
In February 2019, in connection with the annual grant process, PGSUs were awarded to the President and Chief Executive Officer to reflect his pivotal role in the Merger, the importance of his continued leadership to ensure a seamless integration of Barrick and Randgold, and his vision to transform Barrick into the world’s most valued gold and copper mining business. The Senior Executive Vice-President, Chief Financial Officer also received a PGSU award in February 2019.
As described in our 2020 Information Circular, these PGSU awards were restructured in 2020, with one-third of the original awards retained and two-thirds restructured as RSU grants that were approved by the Compensation Committee and the Board in February 2021. As mutually determined by the Compensation Committee, the independent directors of the Board, the President and Chief Executive Officer, and the Senior Executive Vice-President, Chief Financial Officer, certain tranches of these RSU grants were forfeited or further restructured to (1) ensure strong alignment of compensation with the overall shareholder experience, and (2) extend the retention period for these key executives in line with the best interests of the Company and its shareholders. RSUs granted pursuant to these restructured retention awards (Restructured Retention RSU Awards) vest 33 months following the date of grant and upon vesting, the After-Tax Shares are subject to a holding period that precludes any sale of such After-Tax Shares until minimum share ownership requirements are met (in which case only the excess may be sold) or until retirement or departure from the Company.
The President and Chief Executive Officer does not have any outstanding Restructured Retention RSU Awards. The Senior Executive Vice-President, Chief Financial Officer has one outstanding tranche of Restructured Retention RSU Award which is due to vest in December 2025 and will remain subject to the holding requirements described above. No further Restructured Retention RSU Awards are currently contemplated. For more detailed information, please refer to the section titled “Restructured Retention Awards for the President and Chief Executive Officer and the Senior Executive Vice-President, Chief Financial Officer” in the 2023 Information Circular.
Other Executive Compensation Elements
Barrick Share Purchase Plan
The Barrick Share Purchase Plan (BSPP) allows our people to purchase Barrick Shares through payroll deduction and be rewarded for doing so by a matching Company purchase up to a value of $4,000 (Cdn $5,000) per year. The value of the matching Company purchase is reviewed annually and is subject to change from time to time. These matching Barrick Shares must be held until the earlier of five years from the date of purchase or departure from the Company.
Executive Retirement Plans
We administer two supplemental defined contribution Executive Retirement Plans that provide for annual employer contributions equal to 15% of each eligible officer’s annual earned salary and API, which accrue with interest until termination of employment (before the participant’s retirement date) or until retirement, as applicable. The accumulated contributions are paid to the eligible officer in cash upon termination or retirement, as applicable.
Currently, we administer one plan for officers based outside of the United States (including Canada) and another for officers primarily based in the United States.
In 2020, we undertook a review of our Executive Retirement Plans to ensure they are fit for purpose for our increasingly international executive team. Following our due diligence process, we determined that a Retirement Trust Scheme arrangement would be most appropriate for certain participants primarily residing outside of North America. Since 2021, employer contributions equal to 15% of annual earned salary and API for the President and Chief Executive Officer and the Senior Executive Vice-President, Chief Financial Officer have been directed to the Retirement Trust Scheme. Since 2023, employer contributions equal to 15% of annual earned salary and API for the Chief Operating Officer, Latin America and Asia Pacific have been directed to the Retirement Trust Scheme.
All NEOs except for the Chief Operating Officer, Africa and Middle East participate in the Executive Retirement Plan or the Retirement Trust Scheme, as applicable, and do not receive employer contributions toward any other Barrick retirement plan. Click here for a detailed description of the Executive Retirement Plan and the Retirement Trust Scheme.
The Chief Operating Officer, Africa and Middle East receives an annual cash sum equivalent to 15% of annual earned salary and API in lieu of an executive pension arrangement due to low annual limits for pension contributions in South Africa.
Other Benefits and Perquisites
We provide competitive benefits and perquisites to our people. Barrick’s group benefits package for individuals who work full-time may include health, dental, life, disability, and accidental death and dismemberment (AD&D) coverage. Our executives, including our NEOs, may be eligible for additional benefits and perquisites which may include a car allowance, parking benefits, financial counselling, and executive medicals. Certain individuals are eligible for additional perquisites, including additional life, AD&D and long-term disability coverage, as well as ground and air transport.
Barrick is committed to ensuring that the best people are in the right positions throughout our global business. To facilitate this core commitment to retaining the best available talent regardless of borders, relocation support is provided to employees, including our executives, when they are relocated.
2024 Performance Considerations for NEOs
2024 Long-Term Company Scorecard (for 2024 PGSU Awards)
PGSU awards granted in February 2025 in respect of 2024 were determined using the 2024 Long-Term Company Scorecard, with 50% linked to returns and the remaining 50% linked to our growth strategy and commitment towards sustainability leadership. This Long-Term Company Scorecard is based entirely on company-wide measures. A three-year lookback performance period (2022 – 2024) applies to Relative TSR, ROCE, and Reserves Replacement to reward a longer term trend in our performance. Three-year performance for Relative TSR was assessed over 2022 to 2024 on a cumulative basis. Three-year trailing average performance was assessed for ROCE and Reserve Replacement based on performance in 2022, 2023 and 2024. 2024 and historical trending performance were assessed for the remaining measures.
For the 2024 PGSU awards, an overall score of 57.8% was achieved on the Long-Term Company Scorecard. As detailed below, this score reflects performance against each of the Returns, Growth, and Sustainability measures, as well as the Compensation Committee’s discretionary adjustment to cap the score for the Sustainability measure at 80% of its maximum despite the achievement of a Grade A (which would have otherwise resulted in a full payout for this measure) due to the Company’s 2024 and three-year trending safety record. The 20% reduction applied to the scoring for the Sustainability measure further underscores Barrick’s commitment towards a zero-harm workplace and our responsibility as a safe operator.
| Category |
Long-Term Performance Measure |
Weighting |
Performance Period |
Long-Term Performance Basis |
Summary of Assessment
(see accompanying narrative for further details) |
Multi-year Outcome |
Threshold
(25% payout) |
Maximum
(100% payout) |
| Returns |
Relative TSR versus the constituent companies in the GDX(a) |
35% |
2022 – 2024 |
50th percentile |
75th percentile |
Relative TSR positioned at 28th percentile versus the GDX constituents |
Nil |
| Return on Capital Employed (ROCE)(b) |
15% |
2022 – 2024 |
10% |
15% |
2024: 17.9%; 3-year average ROCE(b)14.6% |
14.1% |
| Growth |
Reserve Replacement(c) |
15% |
2022 – 2024 |
3-year rolling average Reserve Replacement >75% |
3-year rolling average Reserve Replacement >100% |
2024: 1,279%; 3-year average Reserves Replacement of 535%(c) |
15% |
| Strategic Execution(d) |
15% |
2024 and year-over-year trending |
Achievement of key priorities and milestones tracked to advance the execution of our strategy |
$1,194 million in total returns to shareholders in 2024 including share buybacks; 20% increase in Operating Cash Flow to $4.5 billion and more than doubled free cash flow(e) to $1.3 billion compared to 2023; maintained focus on gold and copper growth opportunities across key regions, including in Côte D’Ivoire, Ecuador, Jamaica, Peru, Saudi Arabia and Tanzania; significant progress across various major growth projects including Fourmile, Lumwana Super Pit, and Reko Diq; received approval for the renewal of the Special Mining Lease for Bulyanhulu extending it for another 27 years;
continued focus on developing the next generation of talent with the new Barrick Academy and vocational programs launched in the Africa and Middle East region
|
12.8% |
| Sustainability |
ESG and License to Operate(f) |
20% |
2024 and year-over-year trending |
Grade C or lower |
Grade A |
Grade A, but payout adjusted to 80% to reflect 2024 and 3-year trending fatalities
|
16% |
| 2024 Long-Term Performance Outcome (of 100%) |
57.8% |
- Relative TSR is assessed on a cumulative total return basis over the relevant performance period. Dividends paid on Barrick Shares are assumed to be reinvested at the closing share price on the dividend payment date. Relative TSR is calculated with one-month opening and closing averaging periods.
- ROCE is a financial metric that measures profitability as a ratio to the capital base and is therefore a commonly used metric in the mining industry. The calculation of ROCE takes Adjusted EBITDA and divides it by an internal performance measure used to manage performance. ROCE measures return on capital employed by taking Adjusted EBIT (Adjusted EBITDA less depreciation) and dividing by the average capital employed. Adjusted EBITDA is disclosed on page 73 of the MD&A accompanying Barrick’s fourth quarter and full year 2024 financial statements. Capital employed is calculated as total assets exclusive of cash (adjusted for Construction in Progress and assets currently not being depreciated) net of total liabilities exclusive of debt. Construction in Progress and assets currently not being depreciated are disclosed in note 19a to the audited annual financial statements for the year ended December 31, 2024 and primarily relate to assets under construction at our operating mines as well as our development projects including Pascua-Lama, Norte Abierto and Reko Diq. Adjusted EBIT and Adjusted EBITDA are non-GAAP financial performance measures with no standardized meaning under IFRS and therefore may not be comparable to similar measures presented by other companies. For further information and a detailed reconciliation of these non-GAAP measures to the most recently comparable IFRS measures, please see “Other Information – Use of Non-GAAP Financial Performance Measures”.
- Reserves Replacement supports our long-term production forecast and growth profile and is calculated from the cumulative net change in attributable reserves in gold equivalent ounces from the most recently completed year and the trailing two years divided by the cumulative depletion in attributable reserves in gold equivalent ounces from the most recently completed year and the trailing two years (excluding attributable acquisitions and divestments). Gold equivalent ounces are calculated using the relevant reserve prices for each respective year. For further details, see “Other Information – Technical Information – Reserve Replacement”.
- Successful strategy execution will be qualitatively assessed based on considerations such as: capital projects status and progress; ongoing portfolio optimization through asset divestitures and development of growth opportunities consistent with our targeted returns on invested capital and strategic focus; execution of plans to deliver free cash flow per share on a sustainable basis and to drive unit cost efficiencies throughout the business; application of fit-for-purpose processes to drive effective and efficient execution, including demonstrable actions taken to address critical issues facing the business; and achievement of important milestones for strategy execution. Strategic execution will also consider progress towards Barrick’s human capital priorities.
- Free cash flow is a non-GAAP financial performance measure with no standardized definition under IFRS and therefore may not be comparable to similar measures presented by other companies. For further details, see “Other Information – Use of Non-GAAP Financial Performance Measures”.
- Sustainability and license to operate will be assessed based on Barrick’s Sustainability Scorecard which includes quantitative and qualitative measures that track our performance against safety, social and economic development, human rights, environment (including climate), and governance and compliance indicators that are important to Barrick. The assessment will also consider our success in building and maintaining strong relationships with core stakeholders to maintain our license to operate around the world.
Financial Performance Measures (50% weighting)
Relative TSR (35% weighting, assessment: Nil):
Following the Compensation Committee’s thorough review of the Long-Term Company Scorecard in 2023 and taking shareholder feedback into account, we increased the weighting of relative TSR from 15% to 35% and updated the relative TSR peer group from the MSCI Metals & Mining Index to the GDX, which is our external benchmark for TSR performance, to enable a more direct performance comparison with other global gold companies with whom Barrick competes for investment capital. The GDX was used as the relative TSR benchmark for 2024 PGSU awards. The minimum level of performance required to qualify for an award for this measure is median performance, with upper quartile performance qualifying for a maximum award. Barrick’s relative TSR performance, positioned at the 28th percentile versus the constituents of the GDX, was below the minimum level of performance required to qualify for an award for this year. Based on an assessment of Barrick’s three-year TSR versus the performance range set at the beginning of the year, there is no payout for this metric.
Return on Capital Employed(1) (15% weighting, assessment: 94%):
To support our vision to be the world’s most valued gold and copper business and to reinforce our commitment towards delivering long-term and sustainable shareholder returns, ROCE(1) was introduced in 2023 to assess the returns generated as a percentage of our capital base, specifically capital allocated for our operating mines, and to reinforce a continued focus on the efficient use of capital and discipline in capital allocation decisions. Since the Merger, Barrick has made substantial progress in upgrading its portfolio of mines, driving improvements to operational profitability, and reallocating capital to only those projects that meet target returns and support the Company’s long-term investment filters. As a result, ROCE(1) performance has averaged at 14.6% over the past three years, which is near the top end of our long-term performance range of 10% - 15%. In consideration of the above, the payout for this metric is 94%.
Non-Financial Performance Measures (50% weighting)
Reserve Replacement (net of depletion) (15% weighting, assessment: 100%):
Barrick’s ability over time to replace and add to the gold ounces and copper pounds we mine reinforces our sustainability and our sector-leading production profile. Growth is organically embedded in our business and our track record of replacing reserves, combined with our partnership approach and our balance sheet strength to fund this growth, provides the confidence that we can deliver on our organic growth strategy without an undue reliance on costly or dilutive acquisitions.
In 2024, Barrick grew attributable proven and probable gold mineral reserves by 17.4 million ounces(2) before 2024 depletion of 4.6 million ounces. Attributable proven and probable gold mineral reserves now stand at 89 million ounces(2), an increase of 16% from 77 million ounces in 2023. The year-on-year change was led by the conversion of Reko Diq resources to mineral reserves, adding 13 million ounces of gold on an attributable basis, following the completion of the feasibility study(3). At the same time, copper mineral reserves grew by 224% year-on-year on an attributable basis to 18 million tonnes of copper, from 5.6 million tonnes of copper in 2023, resulting from the completion of the Lumwana and Reko Diq feasibility studies(2). Overall, in 2024 Barrick replaced 381% of gold production and 3,904% of copper production, which combined is 1,279% on a gold equivalent ounce basis(4)(5). Over the past three years, Barrick has maintained its record of substantial reserve growth, replacing 535% of attributable gold equivalent ounces(4)(5) net of depletion at a higher grade, which demonstrates the results of an unremitting focus on asset quality and further extending the life of our existing operations. In consideration of the above, the payout for this metric is 100%.
Strategic Execution (15% weighting, assessment: 85%):
Successful strategic execution is assessed based on the progress achieved during the year against the strategic initiatives we disclosed at the beginning of the year and the shareholder value we created both during the year and since the announcement of the Merger. Our strategic initiatives for 2024 included: delivering on our Journey to Zero owned by all and led by the Barrick leadership; growing the business through value adding discoveries and/or acquisitions; and living and instilling our DNA at all levels of the organization including with our contractors. We have made strong progress on each of these strategic initiatives in 2024.
Our strong performance in 2024 has supported the delivery of $1,194 million in total returns to shareholders in 2024, through a combination of dividends and share buybacks. Our balance sheet remains one of the strongest in the gold mining industry, ensuring adequate liquidity to invest in our significant growth projects, including Fourmile (successful drilling program completed), the Lumwana Super Pit (feasibility study completed and permitting for expansion approved), and Reko Diq (updated feasibility study completed and ESIA progressing). At Bulyanhulu, we received approval for the renewal of the Special Mining Lease, extending it for another 27 years, as well as approval of the new decline development which enables access to new reserves and increases mining flexibility. Veladero delivered the best production in the last five years, with Phase 7B of the leach pad successfully commissioned and work commencing on Phase 8A. In addition to continuing our strong track record of reserve additions, we maintained our focus on gold and copper growth opportunities across priority areas in North America, Latin America, and Africa, including new agreements executed on large, prospective portfolios in Ecuador, Jamaica, Saudi Arabia, and Tanzania, new exploration permits granted in Côte D’Ivoire and Zambia, and significant developments in advancing assets in Peru. We remain focused on developing the next generation of leaders with world-class training and development programs that are country-based and tailored to local needs, covering technical, behavioral, and informal learning. The Barrick Academy was launched in Tanzania, which will serve as the training and development center for the Africa and Middle East region and new vocational programs were launched at Reko Diq to support the development of local Balochistan employees. Additionally, the international graduate program at Reko Diq, which is being extended, has enabled graduates from Pakistan to be fully integrated at Veladero. In consideration of the above, the payout for this metric is 85%.
ESG and License to Operate (20% weighting, assessment: 80%):
Our license to operate depends on the combined strength of our safety performance, performance in environmental, human rights, community development, stakeholder relations, and compliance, including anti-corruption. We set a high standard, assess performance and seek continuous improvement. We review and update our targets and metrics annually to reflect our ambitions to improve our performance.
Performance for this measure is assessed based on our industry-first Sustainability Scorecard, which we believe is an important step in driving continual improvement in our management of sustainability issues. Developed in collaboration with independent experts, the Sustainability Scorecard measures our core sustainability key performance indicators informed by international frameworks and adjusted to best reflect Barrick’s business in the wider sector. Measures are reviewed annually based on Barrick’s evolving strategic priorities, our investor and sustainability reporting expectations, and the expectations of the United Nations Global Compact. For 2024, the Sustainability Scorecard included 27 quantitative and qualitative performance indicators that were selected to track our performance across five priority aspects: safety (four indicators); social and economic development (six indicators); human rights (four indicators); environment (including climate, nine indicators); and governance (four indicators).
The scoring methodology was updated in 2024 based on investor feedback regarding the relative weighting and importance given to each indicator within the Sustainability Scorecard. Accordingly, the updated scoring methodology includes a three-step assessment approach that gives equal importance to each of our five priority aspects. First, each performance indicator was ranked in quintiles against our peers, where applicable, as well as against our own internal performance standards. Second, each aspect was scored based on an equal weighted average of the associated performance indicators, and an aspect grade was provided. Finally, the overall score and grade for the Sustainability Scorecard was assessed by sum of the performance for each aspect. A summary of the revised scoring key and assessment framework is shown below.
To underscore our commitment to sustainability and our ambition to achieve a Grade A, no payout is awarded for this metric if the score results in a Grade C or lower. Year-over-year improvement that results in a Grade A qualifies for a maximum payout for this metric.
Based on a review of performance achieved and the scoring against each scorecard category, Barrick’s 2024 performance resulted in a Grade A. For further details regarding the Sustainability Scorecard methodology and 2024 measures, please refer to the Appendix of the 2024 Sustainability Report which will be published in Q2 2025 and can be accessed at www.barrick.com/sustainability.
2024 Sustainability Scorecard Assessment Framework
The scoring methodology was revised in 2024 based on investor feedback, as described above. The total scores and corresponding grades are therefore not directly comparable year-over-year. However, for illustrative purposes, the 2024 trend has been retrospectively calculated in quintiles to provide a benchmark comparison to 2023 performance.
| Sustainability Scorecard Grading Key |
→ |
Assessment Framework for the Long-Term Company Scorecard |
| Grade |
Aspect Score
(Average score of indicators) |
2024 Overall Score
(Sum of performance for each aspect) |
No award
(0%) |
|
Maximum award
(100%) |
| A |
1 |
5 – 8 |
If the score is a Grade C or lower |
to |
If the score is a Grade A |
| B |
2 |
9 – 12 |
| C |
3 |
13 – 16 |
| D |
4 |
17 – 20 |
| E |
5 |
25 |
Abridged 2024 Sustainability Scorecard
| Aspect |
Key Performance Indicator |
2023 Quintile |
2024 Quintile |
2024 Aspect Score and Grade |
Year-over-year Trend |
| Safety |
Total Recordable Injury Frequency Rate (TRIFR) |
1 |
1 |
Average of 2.3
(Grade B) |
 |
| Zero fatalities |
5 |
5 |
| Progress against our Journey to Zero Roadmap |
3 |
2 |
| Percentage of safety leadership interactions completed |
2 |
1 |
| Social and Economic Development |
Percentage of annual Community Development Committees commitments met(2) |
3 |
3 |
Average of 1.8
(Grade A/B) |
|
| Percentage of workforce who are host country nationals |
1 |
1 |
| Percentage of senior management who are host country nationals |
2 |
1 |
| Percentage of economic value that stays in host country |
2 |
2 |
| Increase in national procurement year-on-year |
1 |
1 |
| Proportion of grievances resolved within 30 days(2) |
4 |
3 |
| Human Rights |
Percentage of security personnel receiving training on human rights |
1 |
1 |
Average of 1.3
(Grade A) |
|
| Independent human rights impact assessments with zero significant findings at high risk sites(2)(3) |
1 |
1 |
| Percentage of recommendations completed from independent human rights assessments |
2 |
2 |
| Upgrade controversy listed by one of the ESG rating agencies(4) |
1 |
1 |
|
|
| Environment (including Climate) |
Number of significant environmental incidents |
1 |
1 |
Average of 1.4
(Grade A) |
 |
| Tonne CO2_e per tonne of ore processed |
3 |
4 |
| Progress against absolute emissions target as per Reduction Roadmap(2) | 1 |
1 |
| Water use efficiency (recycled & reused) |
1 |
1 |
| Percentage of completion against Biodiversity Action Plan Commitments(2) |
1 |
1 |
| Percentage of independent tailings reviews conducted(2) |
1 |
1 |
| Global Industry Standard on Tailings Management (GISTM) progress(2) |
1 |
1 |
| Closure liabilities: revenue ratio against peers (New)(1)(4) |
N/A |
2 |
| Proportion of operational sites achieving annual concurrent reclamation targets(2) |
1 |
1 |
|
|
| Governance |
Percentage of employees receiving Code of Conduct training(2) |
1 |
1 |
Average of 1.5
(Grade A/B) |
|
| Percentage of supply partners trained on Code of Conduct at time of on-boarding(2) |
1 |
1 |
| Increase female representation across the organization |
1 |
3 |
| 30% female Board composition |
1 |
1 |
|
|
| Overall Score(5) |
46 (A) |
44 (A) |
Total Score of 8
(A) |
|
- N/A due to changes in the metrics that are not comparable year-on-year.
- Internal metrics.
- In comparison to the 55 extractive companies assessed against the Corporate Human Rights Benchmark’s methodology, Barrick is ranked in the top 25% in the extractives industry.
- Revenue ratio is calculated by Moody’s Ratings based on the total annual value of asset retirement liabilities as a percentage of annual revenue for each company. Companies referenced as peers for the purposes of this assessment include Agnico Eagle, Anglo American, BHP, Codelco, Freeport-McMoran, Newmont, Rio Tinto, South32, Teck Resources, and Vale.
- The scoring methodology was revised in 2024 based on investor feedback and included 27 indicators (of which one was new). The total scores and corresponding grades ae therefore not directly comparable year-over-year.
For 2024, a Grade A was assessed. The 2024 score and achievement of a Grade A, which is the highest score, reflects consistently strong sustainability performance over the past three years. We have also made meaningful progress towards achieving our 2030 and 2050 GHG emissions reduction targets having commissioned the TS Power Plant’s 200MW solar plant (at Nevada Gold Mines), and completed the permitting for Kibali’s solar plant. Despite these key projects, the GHG intensity increased during 2024 as ramp up of the Pueblo Viejo expansion and restart of Porgera commenced. In terms of safety, we reduced our TRIFR and LTIFR by 20% and 47%, respectively, year-over-year, marking the strongest performance since the Merger. Average water efficiency was 85% for 2024, above our annual water recycling and reuse target of 80%. We continued to prioritize the recruitment of host country nationals, who accounted for 97% of our workforce, including 76.2% of site leadership teams, in 2024. In addition, in line with our commitment to drive and support female representation across the organization, as of December 31, 2024, women make up 14% of employees, consistent with our levels in 2023. We continue to prioritize concurrent rehabilitation that minimizes our impact on the environment and, in 2024, we exceeded our Group’s concurrent rehabilitation targets, but also significantly reduced our long-term liabilities.
Despite our notable progress towards achieving our sustainability vision, our safety performance in 2024 did not meet our Journey to Zero focus and we are saddened by the fatalities recorded over the past three years, including the three fatalities recorded in 2024. Our safety performance has been given additional attention with the establishment of new groupwide safety protocols to drive fatal risks down and achieve the zero target we have set for ourselves. Since the launch of our Fatal Risk Management Program in 2024 as part of our Journey to Zero initiative, over 75,000 Critical Control Verifications have been completed, which involved in-field task inspections to verify that fatal risk controls are in place and effective before a task takes place, and implementing any corrective actions where needed. Nothing is more important to us than the health, safety, and well-being of our people. Barrick has zero tolerance for fatalities and therefore any fatality is unacceptable and a strong reminder that we still have work to do to achieve our goal of a zero harm workplace. While our overall score of a Grade A reflects a consistent year-over-year improvement across all other sustainability performance dimensions, to further underscore our commitment towards a zero harm workplace and our responsibility as a safe operator, the payout for this metric was determined to be 80%.
- ROCE is a financial metric that measures profitability as a ratio to the capital base and is therefore a commonly used metric in the mining industry. The calculation of ROCE takes Adjusted EBITDA and divides it by an internal performance measure used to manage performance. ROCE measures return on capital employed by taking Adjusted EBIT (Adjusted EBITDA less depreciation) and dividing by the average capital employed. Adjusted EBITDA is disclosed on page 73 of the MD&A accompanying Barrick’s fourth quarter and full year 2024 financial statements. Capital employed is calculated as total assets exclusive of cash (adjusted for Construction in Progress and assets currently not being depreciated) net of total liabilities exclusive of debt. Construction in Progress and assets currently not being depreciated are disclosed in note 19a to the audited annual financial statements for the year ended December 31, 2024 and primarily relate to assets under construction at our operating mines as well as our development projects including Pascua-Lama, Norte Abierto and Reko Diq. Adjusted EBIT and Adjusted EBITDA are non-GAAP financial performance measures with no standardized meaning under IFRS and therefore may not be comparable to similar measures presented by other companies. For further information and a detailed reconciliation of these non-GAAP measures to the most recently comparable IFRS measures, please see “Other Information – Use of Non-GAAP Financial Performance Measures”.
- Estimated in accordance with National Instrument 43-101 – Standards of Disclosure for Mineral Projects as required by Canadian securities regulatory authorities. Estimates are as of December 31, 2024, unless otherwise noted. Complete mineral reserve and mineral resource data, including tonnes, grades, and ounces, can be found on pages 83-92 of the MD&A accompanying Barrick’s fourth quarter and full year 2024 financial statements. For further details, see endnote 15 of the MD&A accompanying Barrick’s fourth quarter and full year 2024 financial statements and “Other Information – Technical Information”.
- Estimated in accordance with National Instrument 43-101 – Standards of Disclosure for Mineral Projects as required by Canadian securities regulatory authorities. Estimates are as of December 31, 2024, unless otherwise noted. Complete mineral reserve and mineral resource data, including tonnes, grades, and ounces, can be found on pages 83-92 of the MD&A accompanying Barrick’s fourth quarter and full year 2024 financial statements. For further details, see “Other Information – Technical Information”.
- Gold equivalent ounces from Barrick’s copper assets are calculated using long-term mineral reserve commodity prices of $1,400 per ounce of gold and $3.00 per pound of copper. For further details, see “Other Information – Technical Information – Gold Equivalent Ounces”.
- Reserves Replacement supports our long-term production forecast and growth profile and is calculated from the cumulative net change in attributable reserves in gold equivalent ounces from the most recently completed year and the trailing two years divided by the cumulative depletion in attributable reserves in gold equivalent ounces from the most recently completed year and the trailing two years (excluding attributable acquisitions and divestments). Gold equivalent ounces are calculated using the relevant reserve prices for each respective year. For further details, see “Other Information – Technical Information – Reserve Replacement”.
2024 Annual Performance Incentive Considerations
Our API Program is a key component of our executive compensation framework. The Compensation Committee continued its review of the API Program in 2024 in line with its commitment to facilitate a stronger link between payouts and Company performance. Following this review and in response to shareholder feedback, the Compensation Committee approved a two-step reduction to the weighting of the individual component (tied to tailored Strategic Priorities) from 70% to 30% by 2025, with a reduction to 50% in 2024 as a transitionary step. For 2024, the weighting of the Company performance component (ESG, Production, and Costs) was commensurately increased from 30% in 2023 to 50% in 2024. Accordingly, the weightings shown in the each of the Company and regional API Scorecards below reflect weightings out of a total of 50%.
Company performance (and regional performance, where applicable) for the ESG, Production, and Costs measures was reviewed by the Compensation Committee against the applicable performance ranges to determine payouts for 50% of the API Opportunity for 2024. Performance was assessed on a sliding scale between threshold and maximum performance levels to determine payouts. Results are shown out of a maximum of 100% and on a weighted basis out of 50%.
Below is an overview of the Company and regional API Scorecards applicable to the NEOs:
Company API Scorecard
2024 Measures |
Weighting
(of 50%)
|
Threshold
(0% payout)
|
Maximum
(100% payout)
|
2024 Performance |
2024 Result
(of 100%)
|
Weighted Result
(of 50%)
|
ESG (15%) |
Safety (LTIFR)(1) |
5% |
0.25 |
0.21 |
0.12 |
100% |
5% |
Safety (Fatalities) |
5% |
Any fatalities |
No fatalities |
3 fatalities |
0% |
0% |
Environment (Class 1 Environmental Incidents)(2) |
5% |
2 incidents |
No incidents |
No incidents |
100% |
5% |
Production (17.5%) |
Production (Attributable Gold Equivalent Ounces)(3) |
17.5% |
4,436 koz |
5,094 koz
|
4,561 koz |
19% |
3.3% |
Costs (17.5%) |
Gold All-in Sustaining Costs(4) |
13.1% |
$1,469/oz
|
$1,287/oz
|
$1,410/oz |
33% |
4.3% |
Copper All-in Sustaining Costs(4) |
4.4% |
$3.36/lb |
$2.94/lb |
$3.17/lb |
44% |
1.9% |
Overall Company API Scorecard Result |
39% of 100% |
19.5% of 50% |
Latin America and Asia Pacific Region API Scorecard
2024 Measures |
Weighting
(of 50%)
|
Threshold
(0% payout)
|
Maximum
(100% payout)
|
2024 Performance |
2024 Result
(of 100%)
|
Weighted Result
(of 50%)
|
ESG (15%) |
Safety (LTIFR)(1) |
5% |
0.23 |
0.19 |
0.05 |
100% |
5% |
Safety (Fatalities) |
5% |
Any fatalities |
No fatalities |
No fatalities |
100% |
5% |
Environment (Class 1 Environmental Incidents)(2) |
5% |
2 incidents |
No incidents |
No incidents |
100% |
5% |
Production (17.5%) |
Production (Attributable Gold Equivalent Ounces)(3) |
17.5% |
718 koz |
824 koz
|
665 koz |
0% |
0% |
Costs (17.5%) |
Gold All-in Sustaining Costs(4)(5) |
17.5% |
$1,435/oz
|
$1,257/oz
|
$1,288/oz |
83% |
14.5% |
Overall Latin America and Asia Pacific Region API Scorecard Result |
59% of 100% |
29.5% of 50% |
Africa and Middle East Region API Scorecard
2024 Measures |
Weighting
(of 50%)
|
Threshold
(0% payout)
|
Maximum
(100% payout)
|
2024 Performance |
2024 Result
(of 100%)
|
Weighted Result
(of 50%)
|
ESG (15%) |
Safety (LTIFR)(1) |
5% |
0.13 |
0.11 |
0.08 |
100% |
5% |
Safety (Fatalities) |
5% |
Any fatalities |
No fatalities |
3 fatalities |
0% |
0% |
Environment (Class 1 Environmental Incidents)(2) |
5% |
2 incidents |
No incidents |
No incidents |
100% |
5% |
Production (17.5%) |
Production (Attributable Gold Equivalent Ounces)(3) |
17.5% |
1,968 koz |
2,260 koz
|
2,102 koz |
46% |
8% |
Costs (17.5%) |
Gold All-in Sustaining Costs(4) |
13.1% |
$1,317/oz
|
$1,154/oz
|
$1,243/oz |
45% |
5.9% |
Copper All-in Sustaining Costs(4)(5) |
4.4% |
$3.36/lb |
$2.94/lb |
$3.17/lb |
46% |
2% |
Overall Africa and Middle East Region API Scorecard Result |
51.9% of 100% |
26% of 50% |
- LTIFR is a ratio calculated as follows: number of lost time injuries x 1,000,000 hours divided by the total number of hours worked.
- An incident that causes significant negative impacts on human health or the environment, or an incident that extends onto publicly accessible land and has the potential to cause significant adverse impact to surrounding communities, livestock, or wildlife.
- Gold equivalent ounces from Barrick’s copper assets are calculated using long-term mineral reserve commodity prices of $1,400/oz of gold and $3.00/lb of copper. For further details, see “Other Information – Technical Information – Gold Equivalent Ounces”.
- “All-in sustaining costs” is a non-GAAP financial performance measure with no standardized definition under IFRS. Although a standardized definition was published in 2013 by the World Gold Council (a market development organization for the gold industry comprised of and funded by gold mining companies from around the world, including Barrick), it is not a regulatory organization, and other companies may calculate this measure differently. This measure should not be considered in isolation or as a substitute for measures prepared in accordance with IFRS. For further details regarding non-GAAP financial performance measures, see “Other Information – Use of Non-GAAP Financial Performance Measures” .
- For Regional COOs, performance against regional copper costs will only be assessed where there is attributable production in the region.
The individual component of the API Scorecard (tied to tailored Strategic Priorities) accounts for 50% of the 2024 API Award. The Strategic Priorities portion of the 2024 API award for the President and Chief Executive Officer was determined based on the Chairman’s review of his accomplishments against the API Scorecard, with input from the Lead Director, recommended by the Compensation Committee and approved by the independent directors of the Board. The Strategic Priorities portion of the 2024 API awards for our other NEOs were determined based on the President and Chief Executive Officer’s review of their accomplishments against their respective API Scorecards and approved by the Compensation Committee. Details on the individual performance assessment for each of the NEOs are summarized in the next section.

President and Chief Executive Officer
Dr. Mark Bristow was appointed President and Chief Executive Officer of Barrick following the Merger on January 1, 2019. Since that time, Dr. Bristow has been delivering on a clear strategy to build the new Barrick into the world’s most valued gold and copper mining business. The establishment of a world class asset portfolio and the continuous replacement of mined reserves organically since the Merger have distinguished Barrick from its industry peers. In 2024, under Dr. Bristow’s leadership, Barrick delivered a fourth consecutive year of replacing annual depletion at a 4% higher grade, continuing to demonstrate the results of its focus on asset quality and further extending the life of Barrick’s operations. These achievements account for 50% of the API payout. For the remaining 50%, performance was assessed with the Company API Scorecard which includes ESG, Production and Costs measures. On the Chairman’s recommendation and the Compensation Committee’s advice, taking into consideration the 2024 scoring for each performance category summarized below, the independent directors of the Board determined that an API award of $2,944,645 was appropriate.
| API Scorecard Performance Category |
2024 Weighting |
2024 Score |
| Company API Scorecard |
50% |
39% |
| Strategic Priorities |
50% |
70% |
| Overall API Score (of 100%) |
54.5% |
| 2024 Strategic Priorities (50% Weighting) |
| Strategic Initiatives |
- Source, evaluate, and/or pursue internal and external growth opportunities for Barrick
- Lead and participate in annual strategic planning sessions and workshops for key sites
- Direct, lead, and reinforce all aspects of Barrick’s social license to operate across the Group, including stakeholder engagement on community needs, permitting, economic development, and proposed changes in mining-related legislation
- Further strengthen Barrick’s reputation and presence around the world by leading meaningful and consistent engagement with our stakeholders across the globe, including the investor community (shareholders, analysts, and proxy advisors), current and new host governments, trade associations, media, and the general public
|
| Operational Excellence |
- Deliver on Barrick’s 2024 business plan
- Drive investment in brownfields and greenfields exploration to ensure sustainable growth through the replacement of reserves and resources
- Hold mass shift change meetings at every critical operation with a focus on safety
- Promote a focus on strategy, skills, and people development across the Group
|
| Sustainability |
- Drive Journey to Zero
- Chair E&S Committee meetings and provide quarterly reports to the ESG & Nominating Committee and the Board, highlighting progress against the Company’s sustainability goals and compliance with its sustainability policies
- Progress sustainability goals with a focus on emissions reductions and reclamation
|
2024 Accomplishments against Strategic Priorities |
Strategic
Initiatives |
- Feasibility study for Lumwana expansion completed, nearly doubling production projections and extending mine life by 16 years; early works construction commenced, with first production from the expansion anticipated in 2028
- Reko Diq feasibility study completed adding 7.3Mt of attributable copper and 13Moz of attributable probable gold reserves(1); Environmental Impact Assessment completed and early works construction commenced, with first copper and gold production anticipated by the end of 2028
- Pueblo Viejo production ramp up revisited with reconstruction of the conveyer belt and Naranjo Tailings Storage Facility feasibility study completed to enable extension of mine life to 2040s
- Porgera mine successfully restarted
- Wholly-owned Fourmile project advanced to pre-feasibility following a successful 2024 drilling program that showed significant value potential, having increased indicated resources by 192% and inferred resources by 138%(1)
- Established new exploration partnerships in Zambia, Jamaica, and Ecuador
- Led the annual strategic planning sessions and workshops for all key sites
- Engaged with stakeholders to reinforce all aspects of our social license to operate and led investor, government, media and general public engagements; two site visits and six investor webinars held in 2024
- Engaged with governments of all Barrick’s host countries as well as those in new exploration domains to address points of issue and opportunities
- Held multiple meetings with all of Barrick’s top 20 actively managed institutional shareholders, and met with over 400 institutional investors during the year
|
Operational
Excellence |
- Alongside regional and corporate functional executives, led quarterly in-country operational review sessions across all mine sites, including tailored strategic review and team effectiveness sessions with mine and country management teams to drive improvement, growth, and operational excellence for all of our operations, with a focus on local sustainability and human capital matters
- Continued to drive the business strategy with a focus on operational excellence, specifically at Nevada, Pueblo Viejo, and North Mara
- 69% increase in net earnings to $2.14 billion, 51% increase in adjusted net earnings to $2.21 billion and a 30% rise in attributable EBITDA to $5.19 billion for 2024 – the highest in over a decade(2)
- $1.2 billion in total shareholder returns in 2024, including total annual dividends paid to shareholders of $696 million and a further return of $498 million from share buybacks; simultaneously maintained a peer leading balance sheet with very low debt net of cash
- Achieved 2024 production guidance for gold and copper
- Grew attributable proven and probable gold mineral reserves by 17.4 million ounces (23%) before 2024 depletion, led by the conversion of Reko Diq copper-gold resources to mineral reserves, adding 13 million ounces of gold(1)(3)
- Grew attributable copper mineral reserves by 224% year-on-year on an attributable basis, at more than 13% higher grade(3)
- Held mass or shift change meetings at every critical operation with a focus on safety
- Significant drilling results at Nevada Gold Mines, Reko Diq, Loulo, Tanzania and Kibali confirmed quality pipeline of targets, with progress on early-stage targets across Barrick’s expanding greenfields portfolio
- Maintained a strong focus on succession planning, talent development, and productivity. In 2024, appointed a new Managing Director for Nevada Gold Mines, and drove labour efficiency analyses at all sites; facilitated talent reviews and succession planning with the executive team for Barrick’s Top 250 leaders, and expanded the rollout of the Barrick Academy across the Group
|
| Sustainability |
- Tangible progress in our safety program Journey to Zero, achieving a 48% reduction in LTIFR and a 20% reduction in TRIFR year-on-year; regrettably, the safety improvements were offset by fatalities that occurred during 2024
- Africa & Middle East region achieved its lowest Malaria Incident Rate (MIR) on record, lowering the MIR by a further 51% from 2023
- Progressed sustainability goals, including 824ha of land reclaimed and rehabilitated, exceeding the 2024 target by 13%
- In 2024, invested more than $48 million in local economic development, of which more than $9.8 million was in education initiatives
- Shared the benefits of our operations by employing local people, procuring from local businesses, and investing in our local communities; as of December 31, 2024, 97% of employees are host country nationals, 55% of employees are from local communities, and 76% of senior managers are host country nationals
|
- Estimated in accordance with National Instrument 43-101 – Standards of Disclosure for Mineral Projects as required by Canadian securities regulatory authorities. Estimates are as of December 31, 2024, unless otherwise noted. Complete mineral reserve and mineral resource data, including tonnes, grades, and ounces, can be found on pages 83-92 of the MD&A accompanying Barrick’s fourth quarter and full year 2024 financial statements. For further details, see “Other Information – Technical Information”.
- Adjusted net earnings and EBITDA are non-GAAP financial performance measures with no standardized definition under IFRS and therefore may not be comparable to similar measures presented by other companies. For further details, see “Other Information – Use of Non-GAAP Financial Performance Measures”.
- Estimated in accordance with National Instrument 43-101 – Standards of Disclosure for Mineral Projects as required by Canadian securities regulatory authorities. Estimates are as of December 31, 2024, unless otherwise noted. Complete mineral reserve and mineral resource data, including tonnes, grades, and ounces, can be found on pages 83-92 of the MD&A accompanying Barrick’s fourth quarter and full year 2024 financial statements. For further details, see endnote 15 of the MD&A accompanying Barrick’s fourth quarter and full year 2024 financial statements and “Other Information – Technical Information”.
Reported and Realized Pay Comparison for the President and Chief Executive Officer
Reported Pay (excluding pension value) includes base salary, API earned, the grant date fair value of LTI awarded but not yet vested, and all other compensation as reported in the “Summary Compensation Table”.
Realized Pay is the compensation actually received by the President and Chief Executive Officer during the year, including base salary, API earned and all other compensation, as reported in the “Summary Compensation Table”. It also includes the value of LTI awards that vested during the year and for which applicable post-vesting holding restrictions have lapsed, as reported in the “Value Vested or Earned During the Year” table for each respective year. Additionally, it includes the market value of previously vested LTI awards for which the applicable post-vesting holding restrictions lapsed during the year.
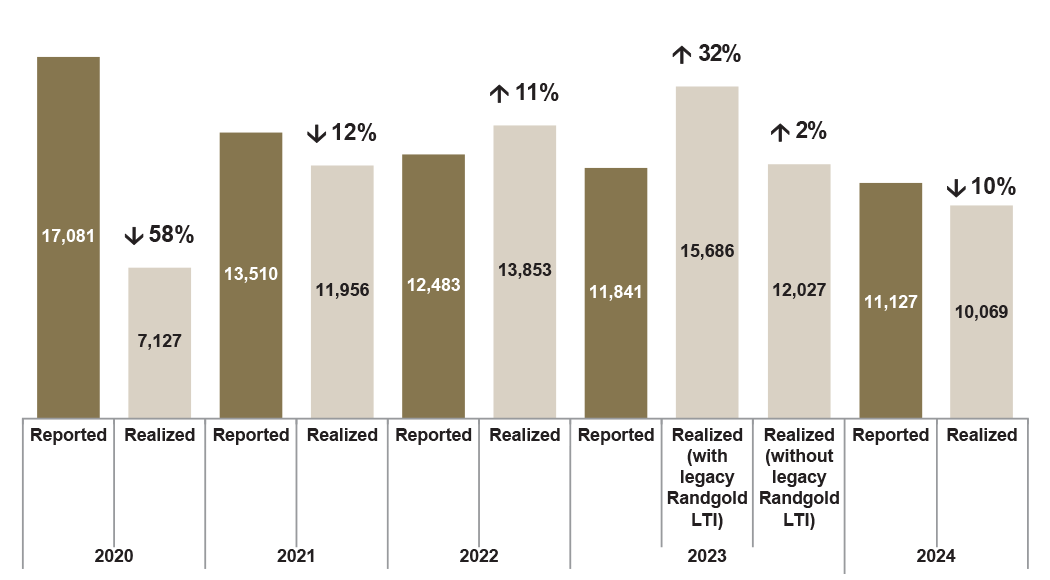
The graph (expressed in thousands of dollars) compares the compensation reported for our President and Chief Executive Officer in the “Summary Compensation Table” with the compensation that he actually received in 2024.
We award a significant portion of our executive compensation in LTI to ensure a sharp focus on long-term value creation. Although LTI awards are reported in the “Summary Compensation Table”, our President and Chief Executive Officer will not actually receive value from these awards until they vest or when the sale and transfer restrictions lapse. The value of these LTI awards at that point may differ from the initially reported value due to changes in our share price and company performance, which ensures the value of the awards reflects the overall shareholder experience over the long-term. The value of the LTI awards reported in the “Summary Compensation Table” therefore represents a future compensation opportunity, rather than an in-year compensation value.
In 2023, Realized Pay included the market value of certain legacy Randgold Restricted Share Scheme and Long-Term Incentive Plan awards that vested in 2021 and became unrestricted following the expiry of the two-year holding period on January 1, 2023 and May 15, 2023, respectively. These legacy Randgold awards were assumed by Barrick at the time of the Merger. For more information on the legacy Randgold Restricted Share Scheme and Long-Term Incentive Plan awards that vested in 2021, please refer to the 2022 Information Circular. The 2023 values are shown including and excluding the realized value of the legacy Randgold awards ($3,659,223) to enable robust comparison with Realized Pay in 2024 and prior to 2023, which years were unaffected by legacy Randgold LTI awards. There are no outstanding unvested legacy Randgold awards.
In 2024, the compensation that our President and Chief Executive Officer actually received (Realized Pay) included his base salary, an API award paid in cash, and benefits and perquisites as incurred. Realized Pay also included the value from certain LTI awards that vested during the year and for which applicable post-vesting holding restrictions have lapsed, namely the vesting of the second and third one-third tranches of the February 2022 PGSUs and the vesting of the first one-third tranche of the February 2023 PGSUs. Upon vesting, the after-tax proceeds were used to purchase Barrick Shares, further bolstering the President and Chief Executive Officer’s already substantial total share ownership position of over six million Barrick Shares as at December 31, 2024.
Over the past five years, Realized Pay was, on average, 7% less than the Reported Pay in the “Summary Compensation Table” when including the value of legacy Randgold LTI awards. In 2024, Realized Pay was 10% lower than the Reported Pay in the “Summary Compensation Table”.
Senior Executive Vice-President, Chief Financial Officer
Mr. Graham Shuttleworth was appointed Senior Executive Vice-President, Chief Financial Officer on January 1, 2019. In determining Mr. Shuttleworth’s API award, the Compensation Committee considered the Company performance achieved for the ESG, Production, and Costs measures, which account for 50% of the API payout. For the remaining 50%, the Compensation Committee also considered the President and Chief Executive Officer’s recommendations and Mr. Shuttleworth’s contributions in advancing our 2024 financial and strategic priorities. After considering the 2024 scoring for each performance category summarized below, the Compensation Committee awarded Mr. Shuttleworth an API of $1,409,139.
| API Scorecard Performance Category |
2024 Weighting |
2024 Score |
| Company API Scorecard |
50% |
39% |
| Strategic Priorities |
50% |
78% |
| Overall API Score (of 100%) |
58.7% |
| 2024 Strategic Priorities (50% Weighting) |
| Strategic Initiatives |
- Lead negotiations on project financing for the Reko Diq project and provide oversight of the structure, timeline, lending group, legal drafting and drawdown structuring to meet Barrick’s investment criteria
- Complete the update of the Company-wide Corporate Risk Assessment to manage risks
- Complete a strategic review and strengthen cybersecurity systems across the Group
- Review opportunities to enhance shareholder returns through dividends and share buybacks
- Review tax exposures and liabilities, and negotiate settlements where appropriate
|
| Operational Excellence |
- Lead strategy and team effectiveness workshops for the financial, commercial, supply chain, systems, information technology and business assurance and risk teams to drive operational excellence and innovation
- Review capital expenditure to ensure efficient use of funds and drive disciplined execution and accuracy in forecasting across the Group to achieve the budgeted costs
- Review global insurance coverage to ensure the program can achieve appropriate risk transfer at the most efficient rates
- Ensure Group Systems Gap Assessment is completed and that detailed and prioritized action plans are developed with the regional leadership teams
- Drive the implementation and integration of enterprise-level information technology systems across the business, including Xeras, OneStream and our daily global reporting system, to enhance planning and control
- Identify and pilot a group contractor management system at one site to enhance safety and compliance with Barrick’s global contractor standards and practices
- Partner with the supply chain function to mitigate critical supplier cybersecurity risks and establish a systematic process for enhancing IT practices across suppliers
- Partner with the mineral resource management function to build a roadmap for the Mine Call Factor Project to enhance mining efficiencies
- Complete a review of Porgera’s connectivity and deliver a fit for purpose solution to support enterprise system usage and communications following the operation’s restart
|
| Sustainability |
- Deliver on Group G&A cost guidance
- Drive simplification of Barrick’s corporate structure by eliminating unnecessary entities, reducing intercompany loans, and addressing tax inefficient funding structures
- Lead benchmarking of operational & financial metrics across sites, regions and peers and define specific short-term improvement action steps with respect to any key gaps
- Drive strategy to effectively address the implications of the OECD Pillar 2 rules globally
- Embed the sustainability financial based metrics into our existing month end close processes with associated controls
- Drive a profitable business that can fund its future through free cash flow from operations(1)
|
2024 Accomplishments against Strategic Priorities |
Strategic
Initiatives |
- Developed the financing plan for Reko Diq, which will be anchored by up to US $3 billion of limited recourse project financing provided by a consortium of multilateral, export credit and import finance agencies
- Completed global risk assessment, identifying potential risks across all business areas, evaluating their impact and likelihood, and mitigation strategies to ensure informed decision-making and corporate resilience
- Advanced Barrick’s cyber strategy and approach to managing and mitigating cybersecurity risks, including implementation of proactive threat intelligence, increased employee training, and simulated phishing attacks and ran tabletop exercises with operational and functional teams to test resilience and readiness
- Renewed share buyback program ensuring the company capitalized on the embedded value in Barrick’s business and growth pipeline; $498 million in total capital returned to shareholders through the buyback program
- Balanced the need to fund growth options to drive future value while maintaining sustainable returns to shareholders; $696 million paid in dividends or US $0.40 per share while debt net of cash remained low
- Successfully negotiated the resolution of significant legacy tax exposures in Chile
|
Operational
Excellence |
- Led strategy and team effectiveness workshops across finance, supply chain, systems, information technology and business assurance & risk group functions to drive operational excellence and innovation
- Led monthly capital review meetings to ensure a disciplined approach to all capital investment decisions based on a comprehensive understanding of risk and reward, including a high degree of rigor; capital expenditure in line with guidance for 2024
- Implemented an automated daily reporting system for Nevada Gold Mines to enhance management and control
- Conducted a comprehensive review of global insurance coverage, optimizing risk transfer strategies and securing the most efficient rates. Successfully identified cost-saving opportunities and enhanced coverage terms, ensuring robust protection for the program while maximizing financial efficiency
- Performed systems gap analysis for key global systems and completed improvement initiatives to address findings, as well as improvements in data integration and automation between systems to increase efficiency in planning and control
- Drove the ongoing implementation of our global suite of systems for Reko Diq in step with the project’s requirements
- Identified and implemented a contractor management system at Lumwana to ensure safety and contract compliance for vendors (including for all new contractors related to the expansion project)
- Established a well-defined process to identify and address critical cyber security risks for key supply chain partners with ongoing processes to ensure continuous improvements
- Delivered a roadmap for the Mine Call Factor application and successfully piloted the application in the Africa and Middle East region and at Phoenix at Nevada Gold Mines
- Successfully completed a comprehensive review of Porgera’s connectivity, identifying critical gaps, and implemented a fit-for-purpose satellite solution. Enhanced network infrastructure to ensure reliability and commenced the implementation of SAP following the site's restart
|
| Sustainability |
- Maintained industry leading low G&A costs by streamlining Barrick’s corporate structure, reducing closure liabilities particularly in relation to legacy mines and driving operational cost efficiencies; delivered 2024 G&A cost reduction of 9%, well below budget and lowest in the last six years
- Performed an initial benchmarking exercise on costs and efficiencies across sites to identify areas of focus and improvement for 2025 which will form the basis of a major cost reduction project in both operations and maintenance
- Led the team on engagements relating to tax reform and tax policy in the key jurisdictions in which the Group operates
- Led team to design and implement corporate structure to mitigate the impact of the OECD Pillar 2 rules on global minimum taxation across the Group
- Ensured sustainability financial-based metrics included in month-end close processes and established framework for the non-financial metrics to follow
- Net earnings increased by 69% year-on-year and free cash flow more than doubled(1)
|
- Free cash flow is a non-GAAP financial performance measure with no standardized definition under IFRS and therefore may not be comparable to similar measures presented by other companies. For further details, see “Other Information – Use of Non-GAAP Financial Performance Measures”.
Senior Executive Vice-President, Strategic Matters
Mr. Kevin Thomson was appointed Senior Executive Vice-President, Strategic Matters on October 14, 2014. In determining Mr. Thomson’s API award, the Compensation Committee considered the Company performance achieved for the ESG, Production, and Costs measures, which account for 50% of the API payout. For the remaining 50%, the Compensation Committee also considered the President and Chief Executive Officer’s recommendations and Mr. Thomson’s contributions in advancing our 2024 financial, operational, and strategic priorities. After considering the 2024 scoring for each performance category summarized below, the Compensation Committee awarded Mr. Thomson an API of $1,350,364.
| API Scorecard Performance Category |
2024 Weighting |
2024 Score |
| Company API Scorecard |
50% |
39% |
| Strategic Priorities |
50% |
73% |
| Overall API Score (of 100%) |
56.3% |
| Strategic Priorities (50% Weighting) |
| Strategic Initiatives |
- Source, evaluate, and pursue external growth opportunities to extend Barrick’s global footprint and increase portfolio optionality
- Drive the negotiation and completion of joint venture agreements, earn-in agreements, and strategic investments in areas with promising geology
- Develop and execute plans for the sale of Barrick’s non-core assets, including closure properties and minority equity interests in other gold mining companies
- Consider global opportunities with potential new partners, including sovereign wealth funds
- Take a leadership role in progressing various initiatives and matters on Reko Diq
- Optimize and restructure existing joint venture agreements and other transaction agreements
|
| Operational Excellence |
- Work with Barrick’s internal legal and governance groups on governance and board issues that arise throughout the year
- Work with Barrick’s internal finance and legal groups on disclosure issues that arise throughout the year in various jurisdictions
- Work with Barrick’s internal legal group to manage legal, regulatory, and litigation issues that arise from time to time
|
| Sustainability |
- Work with Barrick’s internal legal group and others to resolve issues that arise from time to time in partnerships and joint ventures
- Develop and drive government engagement strategies
|
2024 Accomplishments against Strategic Priorities |
Strategic
Initiatives |
- Progressed a number of Reko Diq project initiatives
- Drove multi-disciplinary teams in the assessment and pursuit of various promising external growth opportunities
- Invested in future growth by extending our global exploration footprint via the execution of numerous earn-in agreements in regions in which we have an existing presence including Canada, the U.S., the Dominican Republic, Peru, Tanzania, Zambia and Senegal, and in new regions including Jamaica and Ecuador
- Completed the sale of various non-core equity interests totaling approximately $100 million at significant gains and the divestment of other non-core assets
|
Operational
Excellence |
- Provided guidance and counsel to the President and Chief Executive Officer, as well as the executive leadership team on various strategic matters that arose from time to time throughout the year
- Worked with the leadership teams in our North America, Latin America and Asia Pacific, and Africa and Middle East regions on numerous strategic initiatives and risk mitigation matters that arose throughout the year
- Provided strategic oversight and direction on various litigation, regulatory, and other risk-related matters
- Worked closely with Barrick’s General Counsel on various matters throughout the year
- Provided guidance to Barrick’s Corporate Secretary regarding various governance and disclosure issues throughout the year
|
| Sustainability |
- Worked closely with Barrick’s President and Chief Executive Officer, General Counsel, and others on joint venture issues that arose from time to time throughout the year
- Played a key role in the delivery of Barrick’s 2024 strategic and operational objectives
|

Chief Operating Officer, Latin America and Asia Pacific
Mr. Mark Hill was appointed Chief Investment Officer on September 12, 2016 and held that position until December 31, 2018. Following the Merger, on January 1, 2019, Mr. Hill was appointed Chief Operating Officer, Latin America and Asia Pacific. In determining Mr. Hill’s API award, the Compensation Committee considered Company and regional performance achieved for the ESG, Production, and Costs measures, which account for 50% of the API payout. For the remaining 50%, the Compensation Committee also considered the President and Chief Executive Officer’s recommendations and Mr. Hill’s contributions in advancing our 2024 financial, operational, and strategic priorities including safety improvements across the region. After considering the 2024 scoring for each performance category summarized below, the Compensation Committee awarded Mr. Hill an API of $1,296,912.
| API Scorecard Performance Category |
2024 Weighting |
2024 Score |
| Company API Scorecard |
25% |
39% |
| Latin America and Asia Pacific Region API Scorecard |
25% |
59% |
| Strategic Priorities |
50% |
70% |
| Overall API Score (of 100%) |
59.6% |
| Strategic Priorities (50% Weighting) |
| Strategic Initiatives |
- Advance the growth strategy for the Latin America and Asia Pacific region by supporting the evaluation of external growth opportunities, including those with strategic partners
- Finalize the plan for Pascua Lama
- Complete the feasibility study for Reko Diq and deliver the commercial plan
- Embed Barrick’s DNA at Porgera and Reko Diq through comprehensive integration efforts, ensuring alignment with the new team and fostering a culture that reflects Barrick’s values, mission, and strategic objectives
- Complete the pre-feasibility study and develop a plan for Norte Abierto
- Work with the President and Chief Executive Officer to effectively manage government relationships across the Latin America and Asia Pacific region and initiate government engagements in new countries
|
| Operational Excellence |
- Achieve Group safety improvement goals (lagging and leading) and implement the Fatal Risk Standards and Critical Controls
- Execute on Barrick’s 2024 business plan for the Latin America and Asia Pacific region, including achieving targets (total cash costs of $933 per ounce, All-in sustaining costs of $1,317 per ounce, and capital expenditures of $651 million)(1)
- Complete the construction of phase 7B at the Veladero Leach Pad
- Restart operations at Porgera by January 2024
- Successfully execute the closure of Pierina
- Drive ongoing implementation of Xeras, a mine financial planning software program, across the Latin America and Asia Pacific region
- Develop human resources capabilities across the Latin America and Asia Pacific regional team
- Advance human capital management strategy and develop leadership capabilities across the Latin America and Asia Pacific regional team by delivering on training commitments and university programming
- Right-size the Latin America and Asia Pacific teams
|
| Sustainability |
- Ensure ESG and sustainability are operational imperatives by promoting a Zero Harm workplace, driving GHG reduction strategies across the region, and improving water efficiencies
- Advance the integrated power solution for Pueblo Viejo; key activities include the solar plant project, reviewing the option to add another gas generating unit, and securing the future gas supply for the current plant
- Deliver on diversity targets and develop a plan for Reko Diq and Papua New Guinea
|
2024 Accomplishments against Strategic Priorities |
Strategic
Initiatives |
- Reconstituted Reko Diq project and completed a feasibility study which added 7.3 million tonnes of copper at 0.48% to attributable copper reserves,(2) representing an addition of more than 20 million tonnes of proven and probable copper reserves on a 100% basis since 2023(3)
- The Pueblo Viejo plant expansion delivered and added 11 million ounces of gold to reserves following the completion of the technical study(4); Pueblo Viejo Naranjo Tailings Storage Facility feasibility study completed and drilling ongoing to validate design
- Veladero life of mine was extended to 2033, and the turnaround drives cash delivery
- Repatriated cash from Veladero to enable full shareholder debt repayment by year-end
- Porgera was restarted successfully despite challenges (resolved tax dispute, obtained Special Mining Lease, and executed restart plan)
- Norte Abierto team awarded Bechtel the Stage 2A pre-feasibility study contract; work started in January 2025 and completion is expected by Q4 2025 for Newmont and Barrick review
- Rationalized and refocused exploration projects in the region
- Engaged with government representatives across the Latin America and Asia Pacific region on matters including tax, permitting, local economic development, and legacy environmental liabilities
- Long-standing Chile tax matters were successfully resolved, strengthening relations with the government
|
Operational
Excellence |
- Leading indicator performance greatly improved during 2024 with a focus on the operational Critical Control Verifications plus Hazard Identification training and quality audits
- The Latin America and Asia Pacific region replaced 115% of the regional 2024 gold reserve depletion before the addition of Reko Diq, but delivered slightly below guidance due to a slower-than-expected ramp up at Pueblo Viejo(2)
- Porgera grew attributable gold reserves by 22% year-on-year with the successful conversion of the open-pit Link cutback adjacent to the West Wall cutback(2)
- Veladero delivered the best production in the last five years, the Phase 7A leach pad completed, and the Phase 7B leach pad was successfully commissioned
- Xeras was fully implemented in Pueblo Viejo and Veladero, and introduced to Porgera in 2024 for use starting in 2025; throughout the year, enhancements in automation, forecast traceability, system reliability, and reporting capabilities were achieved
- Significant closure execution; Pierina closure is on track for completion in 2025
- Pueblo Viejo is targeting more than 800 koz of high-margin ounces per annum following ramp-up
- Robust regional succession pipelines put in place
- Revitalized graduate programs at Pueblo Viejo and Veladero, implemented Reko Diq International Graduate Development Program, and relaunched graduate programs at the University of Papua New Guinea to support local Porgerans through higher education in mining-related disciplines
- At Pueblo Viejo, focused on disciplined execution of key engineering projects, plant reliability, and operator training to increase throughput and recovery
- The office footprint in Santiago and Lima is being reduced to support exploration and key activities; closure of Pierina and the associated headcount reduction progressed as planned
|
| Sustainability |
- El Naranjo Tailings Storage Facility is advancing at Pueblo Viejo, including progress on contract tenders and long lead procurement to drive critical supply chain activities, as well as initiation of field work with access road construction
- Pueblo Viejo ESIA approval was obtained, and the Resettlement Plan is advancing
- The Veladero power line was commissioned to reduce GHG emissions and generate efficiencies
- Workforce diversity has improved, with increased female representation; Pueblo Viejo received international recognition for its diversity efforts, while Veladero was acknowledged as a leader in gender balance practices within Argentina
- Continued to advance community development programs at Reko Diq, including the reopening of two schools after more than 10 years
- Annual year-on-year GHG emissions for the region (currently undergoing verification), increased by 10%, primarily driven by the Porgera restart and an increase in lime consumption at Pueblo Viejo; overall emission intensity (tCO2e/ t ore processed) decreased by 4%
- Diversity has improved through the continued prioritization of recruiting local nationals, who comprised 97% of the Latin America and Asia Pacific region’s workforce by the end of 2024; efforts to enhance gender diversity have also progressed, with women representing 24% of the workforce in Latin America and 18% across the Latin America and Asia Pacific region by the end of 2024, accounting for 19% of new hires in the Latin America and Asia Pacific region in 2024, with a notable 44% in Latin America
- Barrick and Zijin contributed $1 million to support Papua New Guinea landslide victims
- Initiated solar site investigation at Pueblo Viejo
|
- Total cash costs and all-in sustaining costs are non-GAAP financial performance measures with no standardized definition under IFRS. Although standardized definitions were published in 2013 by the World Gold Council (a market development organization for the gold industry comprised of and funded by gold mining companies from around the world, including Barrick), it is not a regulatory organization, and other companies may calculate this measure differently. This measure should not be considered in isolation or as a substitute for measures prepared in accordance with IFRS. For further details regarding non-GAAP financial performance measures, see “Other Information – Use of Non-GAAP Financial Performance Measures”.
- Estimated in accordance with National Instrument 43-101 - Standards of Disclosure for Mineral Projects as required by Canadian securities regulatory authorities. Estimates are as of December 31, 2024, unless otherwise noted. Complete mineral reserve and mineral resource data, including tonnes, grades, and ounces, can be found on pages 83-92 of the MD&A accompanying Barrick’s fourth quarter and full year 2024 financial statements. For further details, see “Other Information – Technical Information”.
- Estimated in accordance with National Instrument 43-101 – Standards of Disclosure for Mineral Projects as required by Canadian securities regulatory authorities. Estimates are as of December 31, 2024, unless otherwise noted. Complete mineral reserve and mineral resource data, including tonnes, grades, and ounces, can be found on pages 83-92 of the MD&A accompanying Barrick’s fourth quarter and full year 2024 financial statements. For further details, see endnote 15 of the MD&A accompanying Barrick’s fourth quarter and full year 2024 financial statements and “Other Information – Technical Information”.
- For further details, refer to the Technical Report on the Pueblo Viejo Mine, Dominican Republic, dated March 17, 2023 and filed on SEDAR+ at www.sedarplus.ca and EDGAR at www.sec.gov on March 17, 2023.

Chief Operating Officer, Africa and Middle East
Mr. Sebastiaan Bock was appointed Senior Vice President, Chief Financial Officer, Africa and Middle East on January 1, 2019 and was appointed Chief Operating Officer, Africa and Middle East on July 1, 2022. In determining Mr. Bock’s API award, the Compensation Committee considered the Company and regional performance achieved for the ESG, Production, and Costs measures, which account for 50% of the API payout. For the remaining 50%, the Compensation Committee also considered the President and Chief Executive Officer’s recommendations and Mr. Bock’s contributions in advancing our 2024 financial, operational, and strategic priorities. After considering the 2024 scoring for each performance category summarized below, the Compensation Committee awarded Mr. Bock an API award of $1,021,906.
| API Scorecard Performance Category |
2024 Weighting |
2024 Score |
| Company API Scorecard |
25% |
39% |
| Africa and Middle East Region API Scorecard |
25% |
52% |
| Strategic Priorities |
50% |
78% |
| Overall API Score (of 100%) |
61.9% |
| Strategic Priorities (50% Weighting) |
| Strategic Initiatives |
- Deliver at least one new growth project outside the current portfolio for the Africa and Middle East region
- Deliver the Lumwana feasibility study and ensure readiness for project set-up in 2025
- Drive the improvement of mining efficiencies to the planned feasibility study levels of the Super Pit at the Lumwana copper mine
- Work with other Barrick executives to grow the Africa and Middle East region through value-adding discoveries and acquisitions, including the expansion of Barrick’s copper portfolio
|
| Operational Excellence |
- Maintain and grow the 10-year production profile, supported by a robust and integrated exploration pipeline, and integrate rolling plans into the business with a clear focus on costs
- Deliver on Barrick’s 2024 business plan for the Africa and Middle East region
- Manage stock holdings to agreed levels on all sites and continuously review and manage optimal broken stock and stockpiles at each operation to maintain operational flexibility
- Review and update the power roadmap for Lumwana, Tanzania, and Saudi Arabia, and deliver in line with commitments
- Review the needs of each site and set out a roadmap for technological innovation in conjunction with functional executives
- Ensure Tailings Storage Facility actions for “Very High” and “Extreme” consequence facilities in the region, as classified under the GISTM, remain on track
- Deliver the efficient integration of information technology and operational technology systems across the Africa and Middle East region, and drive accountability across the business
- Develop human resources capabilities across the Africa and Middle East regional team, and launch the Leadership & Management program in the Africa and Middle East region for frontline management
- Manage the ramp-up of the Lumwana workforce and ensure it is integrated operationally
- Review the graduate and bursary programs across Africa and Middle East region, agree with Barrick Exco on strategy, and execute strategy
|
| Sustainability |
- Drive the development of host country nationals and deliver on localization targets for 2024
- Deliver an integrated Lumwana housing and economic development plan to build on our social license
- Advance investment in Barrick’s REDD+ program surrounding Lumwana as part of Barrick’s future investments in community projects and contributions to the Zambian economy
|
2024 Accomplishments against Strategic Priorities |
Strategic
Initiatives |
- Expanded exploration frontiers in the Central African Copper Belt, which positions Barrick to capitalize on the copper fundamentals
- Lumwana expansion permitted and engineering partners appointed; on track with early works design and long lead item fabrication
- Completed the Lumwana Super Pit expansion feasibility study, which added 5.5 million tonnes of copper reserves to the project, resulting in proven and probable copper reserves of 8.3 million tonnes of copper at 0.52%(1)(2)
- New decline development commenced at Bulyanhulu to access new reserves and increase mining flexibility
- Significant drilling results at Loulo, Tanzania, and Kibali confirm a quality pipeline of targets, with progress on early-stage targets across Barrick’s expanding greenfields portfolio
|
Operational
Excellence |
- Solid 10-year production profile extended, driven by investment and growing the 15-year growth pipeline
- Growth of gold mineral reserves in the Africa and Middle East region is predominantly driven by both Bulyanhulu and Loulo-Gounkoto, with extensions of the high-grade Reef 2 and Yalea underground orebodies, respectively, combined with growth of the Faraba open pit
- Ongoing conversion drilling at Kibali replaced 98% of depletion, with ongoing development to establish further underground drill platforms for 2025(1)
- Delivered the Lumwana Expansion feasibility study adding significant mineral reserves, with the operation projected to produce 240kt pa copper from a 52Mt pa process plant expansion extending mine life to more than 30 years
- Delivered on 2024 production guidance for the region
- Tongon, Bulyanhulu, Jabal Sayid and Buzwagi achieved a full year without a Lost-Time Injury
- Kibali gold mine achieved the highest yearly throughput since its commissioning, underscoring the mine’s continued focus on operational excellence
- Lumwana delivered record production in Q4 2024
- Ensured appropriate flexibility built into mine plans across the region with a focus on stockpiles, broken stocks and development achievement
- Tailings Storage Facility projects on track across the region
- Further strengthened the management team at Kibali and refocused exploration on highly prospective areas within the Kibali permit which hold significant potential to bolster the mine’s reserve pipeline
- Africa and Middle East region achieved its best MIR on record (51% reduction from 2023)
- Launched the Leadership & Management program in the Africa and Middle East region, which will train more than 2,500 foremen, supervisors, and superintendents across the region by the end of 2025
- Launched the Africa and Middle East regional bursary scheme focused on developing young people from our host nations to study mining and finance-related fields
- Progressed power solutions to improve grid stability in Zambia and Tanzania with solid action plans commencing in 2025 and progressed the Saudi Arabia power map to incorporate a grid connection planned for 2026
- Implemented real-time data tools for day-to-day management of key performance indicators at Kibali with a planned wider roll-out across the Group
- Improvement in Lumwana mining performance driven through the implementation of operator level key performance indicator tracking
- Managed the initial onboarding of the core construction team for the Lumwana expansion and implemented a planned ramp-up of the Lumwana workforce for the expansion which integrates with the ongoing operation
- Delivered on our Tailings Storage Facility strategies, with the remaining expenditure on track, securing further future growth
|
| Sustainability |
- Developed a model for renewable energy in African mining through the significant progress on the construction of a 16 MW solar plant at Kibali, designed to reduce carbon dioxide emissions from 45kt to 24kt per year
- Delivered on GHG Reductions Roadmap with the progress made on the solar power and BESS project at Kibali
- Improved diversity through the continued prioritization of recruiting local nationals (95.29% of the Africa and Middle East region’s workforce at the end of 2024), as well as the continued drive to increase gender diversity, with women representing 8.48% of the region’s workforce at the end of 2024 (up from 7.72% in 2023) and comprising 13.13% of new hires in 2024
- The Ma’aden Barrick Copper Company (MBCC), a 50/50 joint venture between Barrick and Ma’aden, became the first mine in Saudi Arabia to recruit women to work in remote areas for operational roles; training deployed for 15 women across multiple disciplines, including as instrument and planning engineers in the maintenance department, and as chemists in the process plant
- Continued investment in our REDD+ initiative surrounding Lumwana, to offset environmental impacts, partnering with local chiefdoms and the Zambia government; ~200,000 hectares of forest already secured for the project
- Progressed the development of a regional hub in Zambia focused on expanding the current Zambian mining skills and building national companies through an industrial supplier park, creating a new town development for 2,000 employee homes, and building an airstrip to facilitate growth of the economy and improve transport links
|
- Estimated in accordance with National Instrument 43-101 - Standards of Disclosure for Mineral Projects as required by Canadian securities regulatory authorities. Estimates are as of December 31, 2024, unless otherwise noted. Complete mineral reserve and mineral resource data, including tonnes, grades, and ounces, can be found on pages 83-92 of the MD&A accompanying Barrick’s fourth quarter and full year 2024 financial statements and “Other Information – Technical Information”.