All amounts expressed in US dollars unless otherwise indicated.
Toronto, August 12, 2019
— Barrick Gold Corporation (NYSE:GOLD)(TSX:ABX) today reported second quarter production of 1.353 million ounces of gold in line with the solid base (1.367 million ounces) set in Q1 and driven by strong performances at Loulo-Gounkoto in Mali and Veladero in Argentina.
President and chief executive officer Mark Bristow said at this halfway mark of the year, annual gold production is expected to be at the upper end of the 2019 guidance range with cost metrics at the lower end of the ranges. Nevada Gold Mines, the joint venture launched on July 1, should impact positively on Barrick’s production profile and is on track to deliver synergies of up to $500 million per year in the first five years.
Net earnings were $0.11 per share. Adjusted net earnings of $0.09 per share
1
were in line with market consensus and debt net of cash was unchanged at $3.7 billion after payment of the Q1 dividend. The $0.04 quarterly dividend per share was maintained for Q2. Following the end of the quarter, Barrick repurchased $248 million of outstanding debt due in 2020, saving annualized interest of approximately $12 million. Net cash provided by operating activities of $434 million remained strong.
Bristow said in the six months since the Barrick-Randgold merger was consummated, management had made enormous progress in building a business that would be a model of value creation for the mining industry.
2019 Q2 Highlights
-
Nevada Gold Mines launched successfully: positively impacts group production outlook
-
Adjusted net earnings of $0.09
1
in line with consensus
-
Debt net of cash unchanged after Q1 dividend payment
-
Quarterly dividend of $0.04 maintained
-
PV plant expansion pre-feasibility study on track for year-end completion
-
African operations post strong performance
-
Offer made to acquire minority interests in Acacia
Financial and Operating Highlights
| Financial Results |
Q2 2019 |
Q1 2019 |
Q2 2018 |
| Realized gold price 2,3 ($ per ounce) |
1,317 |
1,307 |
1,313 |
| Net earnings (loss) ($ millions) |
194 |
111 |
(94) |
| Adjusted net earnings 1 ($ millions) |
154 |
184 |
81 |
| Net cash provided by operating activities ($ millions) |
434 |
520 |
141 |
| Free cash flow 4 ($ millions) |
55 |
146 |
(172) |
| Net earnings (loss) per share ($) |
0.11 |
0.06 |
(0.08) |
| Adjusted net earnings per share 1 ($) |
0.09 |
0.11 |
0.07 |
| Total Attributable Capital Expenditures 5 ($ millions) |
361 |
361 |
303 |
| Operating Results |
|
|
|
| Gold |
Q2 2019 |
Q1 2019 |
Q2 2018 |
| Production (000s of ounces) |
1,353 |
1,367 |
1,067 |
| Cost of sales 6 (Barrick's share) ($ per ounce) |
964 |
947 |
882 |
| Total cash costs 7 ($ per ounce) |
651 |
631 |
605 |
| All-in sustaining costs 7 ($ per ounce) |
869 |
825 |
856 |
| Copper |
|
|
|
| Production (millions of pounds) |
97 |
106 |
83 |
| Cost of sales 6 (Barrick's share) ($ per pound) |
2.04 |
2.21 |
2.45 |
| C1 cash costs 8 ($ per pound) |
1.59 |
1.66 |
2.10 |
| All-in sustaining costs 8 ($ per pound) |
2.28 |
2.46 |
3.04 |
Key Performance Indicators
-
Another strong quarter points to annual production at top end of guidance range and costs at lower end
-
Debt net of cash unchanged at $3.7bn, after payment of Q1 dividend
-
Adjusted net earnings per share of $0.09
1
in line with consensus
-
Copper operations continue efficiency improvements with AISC
8
down 7%
-
Nevada Gold Mines JV closed July 1 and set to deliver forecast synergies with positive impact on production outlook for the year
-
Pueblo Viejo progresses plant expansion prefeasibility study expected by year end
-
African and LatAm operations deliver as Loulo-Gounkoto joins Kibali and Veladero with strong performance
-
Drilling at Fourmile returns best-ever borehole intersection; Loulo-Gounkoto and Kibali on track for further brownfields expansion to replace depletion
-
Agreement reached on Recommended Final Offer for shares in Acacia not already owned by Barrick
-
ICSID arbitration award represents significant milestone in recognition of Reko Diq project value
-
Sustainability report underscores group’s commitment to environmental and social goals
-
Decrease in Lost Time and Total Recordable Injuries from Q1
- $0.04 per share quarterly dividend maintained for Q2
“We’ve rationalized the corporate structure; assembled a team committed to, and capable of, achieving our ambitious goals; established three regions for the effective management of our global portfolio; and aligned operational management teams with our core vision - that of delivering the best returns by combining the best assets with the best people. In addition to settling down the new Barrick, we delivered the Nevada joint venture, the world’s largest gold production complex in its richest gold field, and brokered a solution for Acacia’s long stand-off with the Tanzanian government. That’s a lot of boxes ticked in a short time,” he said.
"Our ongoing focus will be deepening our team skills and building our succession initiatives. Mining is always going to be about its human capital and that is why we invest in the best people."
Bristow noted that Nevada Gold Mines owned three of the world’s top 10 Tier One
9
gold assets with a fourth potentially in the making in the form of the Goldrush-Fourmile project, as well as proven and probable reserves of more than 48 million ounces
10,11,12
, presenting Barrick with a host of value-creation opportunities.
Elsewhere, Pueblo Viejo in the Dominican Republic, another Tier One
9
mine, offered what was probably the group’s most exciting growth prospect, he said. On a 100% basis, this is a billion-dollar plant expansion project which is expected to deliver annual average production in excess of 800,000 ounces from 2022 to beyond 2030
13
. In Papua New Guinea, the extension of Porgera’s special mining lease, currently being negotiated, should double the life of this potential Tier One
9
mine, currently standing at 10 years.
Globally Barrick is pursuing an aggressive exploration strategy which includes a renewed focus on Latin America and in particular on the highly prospective El Indio Belt which spans Argentina, Peru and Chile. The African assets are on track for brownfields resource replacement and there are opportunities for major new discoveries along the Mali-Senegal Shear Zone and the Congolese and Tanzanian cratons. In Nevada, exceptionally high grades intersected at Barrick’s Fourmile project have confirmed its potential for significant resource growth.
Bristow said after the acquisition of the Acacia minority shareholders' interests, which should be finalized next month, Barrick would integrate that company’s assets into its portfolio. He cautioned that there was a great deal of work to be done in getting to grips with the Acacia operations, which have not been managed by Barrick; implementing the dispute solution agreed in principle by executive chairman John Thornton and the Tanzanian president; and rebuilding relations with in-country stakeholders.
Conference Call and Webcast
Please join us for a conference call and webcast today at 11:00 EDT/15:00 UTC to discuss the results.
US and Canada, 1-800-319-4610
UK, 0808 101 2791
International, +1 416 915-3239
Webcast
The event will be available for replay online or by telephone at 1-855-669-9658 (US and Canada) and +1 604 674-8052 (international), access code 3107.
BARRICK STRENGTHENS BOARD: APPOINTS LORETO SILVA INDEPENDENT DIRECTOR
Barrick has appointed Loreto Silva to the Company’s Board of Directors as an independent non-executive director.
An accomplished legal professional, academic and consultant, Loreto is Chile’s former Minister of Public Works and the current chairperson of the board of ENAP, the country’s national petroleum company. She is also a partner at the Chilean law firm of Bofill Escobar Silva Abogados.
Loreto started her career as a lawyer for the Chilean Chamber of Construction where she helped develop the country’s sanitary and public works concession systems. She specialized in public works concession contracts, competition, water resource management as well as the development of electric, sanitary and infrastructure projects.
In 2010, Loreto was appointed Vice Minister of Public Works and became Minister of the department at the end of the 2012. As Minister, she promoted and led complex infrastructural works such as the bridge over
the Chacao Channel and the Américo Vespucio Oriente highway. She also led the development of the National
Water Resource Strategy and is currently director of the Arbitration and Mediation Center of the Santiago Chamber of Commerce ("CAM"), director at the Infrastructure Policy Council ("CPI") and member of Women Corporate Directors.

Executive chairman John Thornton says her appointment will broaden the skills of the Board and add fresh perspective. “We are pleased to welcome Loreto to the Barrick Board, which will benefit from her significant knowledge of large-scale infrastructural projects and wide-ranging experience in legal and government affairs.”
 NEVADA GOLD MINES: VALUE CREATION GETS ANOTHER LEADER
The first half of 2019 saw three of the biggest deals in the history of the gold mining industry: Barrick merged with Randgold, Newmont acquired Goldcorp, and then the two merged companies pooled their Nevadan assets in a new business called Nevada Gold Mines. These transactions have not only transformed the fortunes of the companies involved: they have also changed the industry’s future shape and direction.
The logic for the Nevada joint venture had long been obvious, indeed compelling, says Barrick president and chief executive officer Mark Bristow, who championed the deal. Efforts to achieve it, however, were serially scuppered by factors unrelated to its merits, until a fresh push by the new Barrick management team finally got the joint venture over the finish line.
“The Barrick-Randgold union was driven by a vision of real, sustainable value creation for all stakeholders, and the same motivation provided the rationale for the Nevada joint venture. The opportunities and efficiencies arising from the combination will maximize the potential of the Nevada gold fields and will deliver longer profitable mine lives, longer term employment, longer term benefit sharing with local communities and longer-term support for the state’s economy,” Bristow said.
With 10 underground mines, 12 open pits, two autoclave facilities, two roasting facilities, four oxide mills and five heap leach facilities, Nevada Gold Mines is the world’s largest gold mining complex, with annual production estimated at 3.5 million to 4.0 million ounces.
Putting together this enormous and complex organization in the few months between the announcement of the joint venture and the launch of the new company on July 1 required hard work and thousands of man (and woman) hours by individuals and teams across both founding businesses.
Catherine Raw, Barrick’s chief operating officer for North America, said integration was a simple objective but a complex task that required an enormous effort. Nevertheless, in that short time, a world-class leadership team was selected from the two companies, and 7,000 employees were integrated in a company under the banner ‘One Team. One Mission.’ In addition, technology and system adaptations provided a near-seamless transition for employees.
“The proximity of the operations has opened opportunities for improved efficiencies and cost-effectiveness, and the new company has already combined the management of Twin Creeks with that of Turquoise Ridge and Carlin with Goldstrike. Many efficiencies will be realized simply by removing the physical barriers between the Barrick and Newmont Goldcorp properties, allowing people, equipment and ore to move freely between the sites, depending on the needs of the business,” she said.
Nevada Gold Mines has taken on Barrick’s commitment to partnering with host communities, which it regards as key stakeholders in the business. This includes minimizing operational impacts and maximizing business and learning opportunities in these communities. The support of these stakeholders was crucial to the success of the joint venture, and throughout the transition both companies engaged with them to share information and hear concerns.
There were more than 2,000 such stakeholder touchpoints, which included town-hall meetings and presentations to city and tribal councils. Nevada Gold Mines is owned 38.5% by Newmont Goldcorp and 61.5% by Barrick, which manages the business.
 DOI SECRETARY BERNHARDT VISITS NEVADA GOLD MINES, REVIEWS PERMITTING PROCESS
US Secretary of the Interior David Bernhardt has visited Nevada Gold Mines’ Cortez mine on July 23 where he saw first-hand its Deep South expansion project, a highlight of the Department’s expedited permitting process.
The Deep South project will extend the life of Cortez, which has been in continuous operation since 1862 and now ranks as one of the world’s Top 10 Tier One
9
gold mines. It is a key initiative for Nevada Gold Mines, a joint venture launched earlier this month and owned 61.5% by Barrick, which operates it, and 38.5% by Newmont Goldcorp.
Nevada Gold Mines’ executive managing director Greg Walker said the company was delighted to host Secretary Bernhardt and noted that as Deputy Secretary, he led the process reform which helped to expedite the review of the Deep South environmental impact statement (EIS).
“The Deep South EIS represented a significant enhancement of the National Environment Policy Act (NEPA) permitting process. In the past, each EIS approval required up to 18 months for Notices of Intent and Availability. The industry worked with the Department of the Interior (DOI) to see if this step in the process could be streamlined and the solution provided by then Deputy Secretary Bernhardt delivered a material improvement,” he said.
“Some 98% of our former, current and planned operations are on public land administered by DOI agencies and we maintain a close and productive relationship with the Federal Government and the State of Nevada. The Department authorizes mining on public land and regulates landscape-scale habitat upliftment projects. As partners with the DOI, we support the protection of sage-grouse and rehabilitation of their habitat as well as an outcome-based grazing pilot program, to benefit the land and local communities.”
Walker said Nevada Gold Mines was destined to be one of the world’s greatest gold mining operations and planned to mine several world-class projects in its immediate and longer-term future. These include newly identified deposits at Goldrush, Robertson and perhaps Fourmile, as well as the expansion of the existing ore bodies at Cortez Hills, Pipeline and other locations. These growth projects will continue to provide a broad range of employment opportunities for years to come. All these projects, he said, are dependent on the NEPA process and its continued improvement.
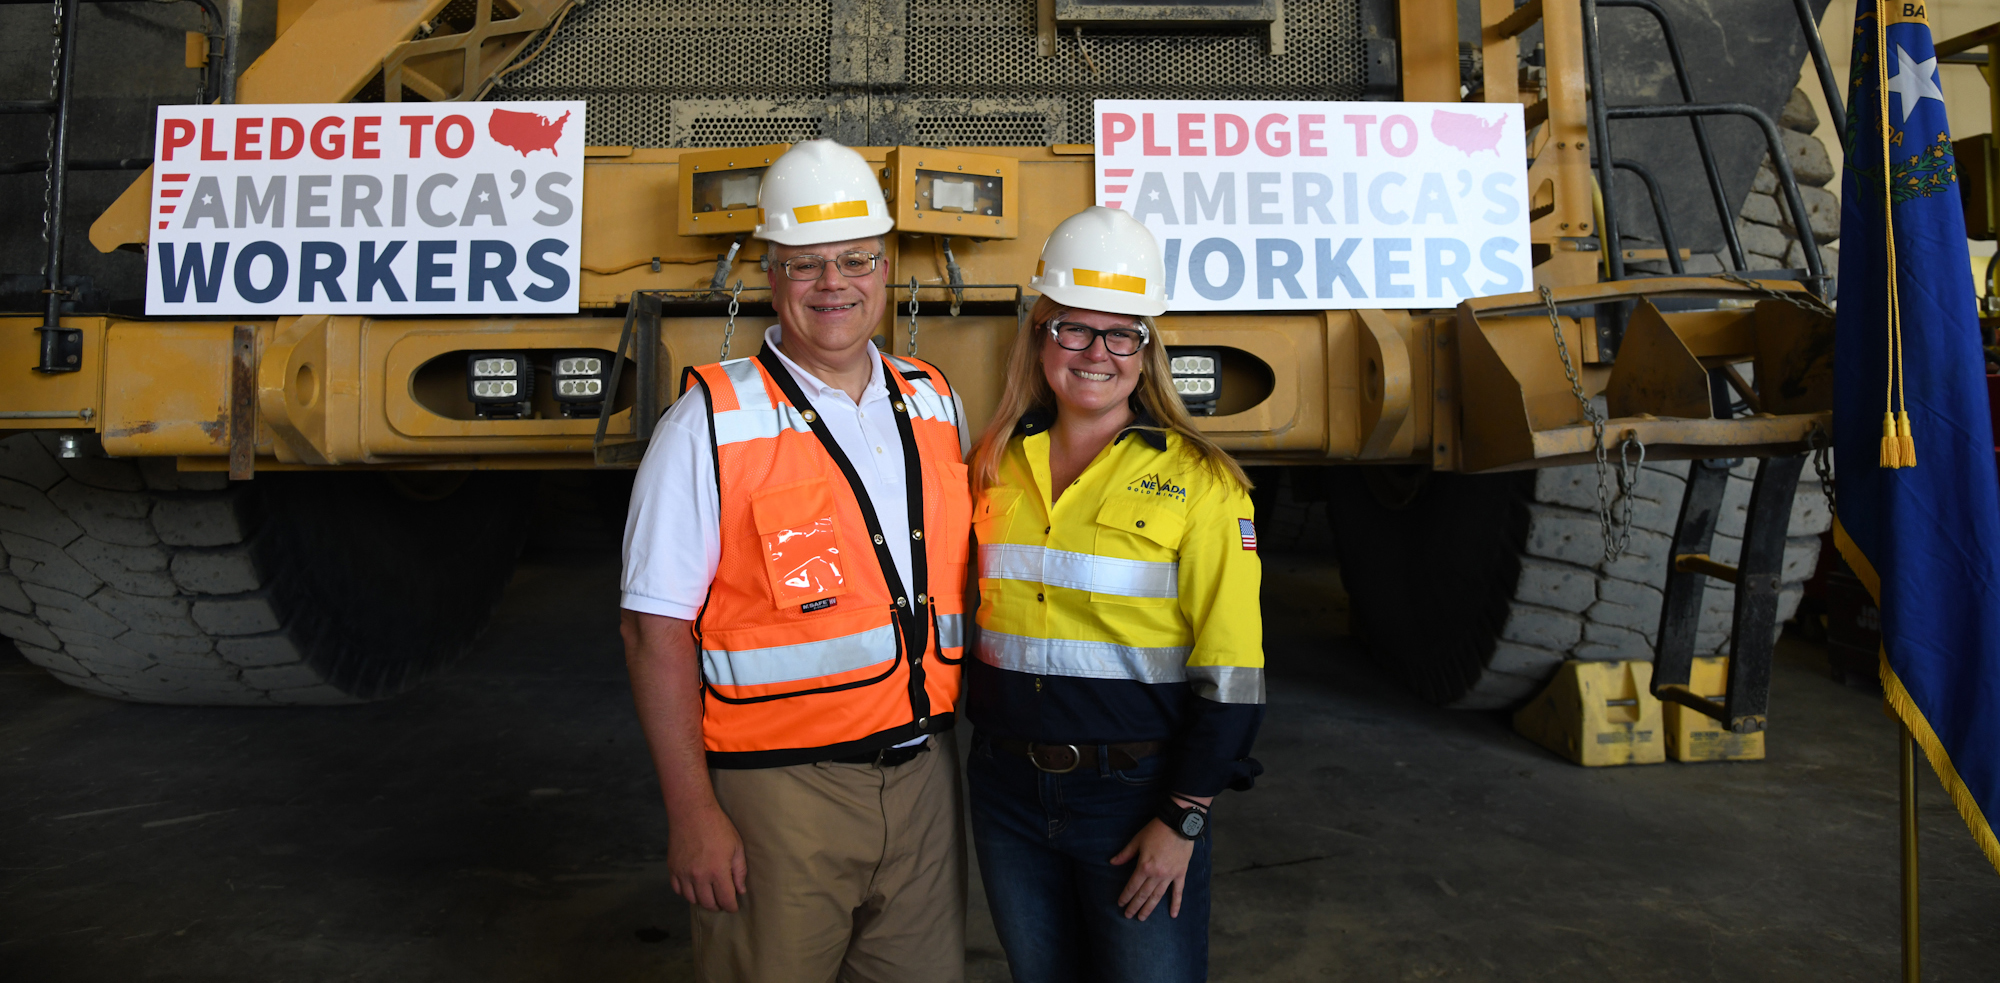
“Our mission is to create sustainable, long-term value for all stakeholders, not least the state and people of Nevada by combining best assets with best people. To achieve this we are committed to continue building on our education, training and upskilling programs which involve scholarships, bursary schemes, such as leadership development and Science Technology Engineering Art Math (STEAM) initiatives in school and university education and vocational training institutions, as well as on the job training with a strong focus on America’s workers,” he said.
 BEST ASSETS + BEST PEOPLE = BEST RETURNS
To build a world-class business you need world-class people, says Barrick president and chief executive Mark Bristow. To get the best returns, you combine the best assets with the best people, which is why Barrick has such a strong focus on attracting, retaining and developing a highly skilled and engaged workforce.
The company offers internal and external development programs for employees while leadership and management training is provided through top universities.
It also caters to the next generation of leaders. Barrick currently hosts some 100 university students at its operations, providing them with on-the-job learning to complement their studies. These internships also enable the company to assess their potential as future employees.
New graduates are targeted through recruitment programs at 20 universities globally. Those who join the company fresh from university, or have less than three years’ mining experience, are equipped for their careers through a two- to three-year mentor-based learning program. The recently introduced operator excellence curriculum provides technical training for all the trades needed at a mine. It has been successfully piloted at Porgera and in the Dominican Republic and additional sites are in the works.
 GOVERNOR STEVE SISOLAK VISITS NEVADA GOLD MINES’ WORLD CLASS MINE
Nevada Governor Steve Sisolak recently joined Barrick President and CEO Mark Bristow in hosting a meeting of local, regional, and tribal leaders in Elko, Nevada. As Chairman of Nevada Gold Mines, Bristow updated the community stakeholders on progress with the joint venture between Barrick Gold Corporation and Newmont Goldcorp Corporation.
The event underscored the long-term benefits of the joint venture launched in July this year. The new company is owned 61.5% and operated by Barrick, and owned 38.5% by Newmont Goldcorp.
Speaking to the community leaders, Mark Bristow said the joint venture partners were eager to demonstrate the lasting value the company would bring to the state.
“Nevada Gold Mines is an opportunity to generate additional long-term value for our shareholders, employees and the communities of Nevada,” he said
“It positions Northern Nevada as the world’s greatest gold mining complex. By combining the assets, talents and expertise of Barrick and Newmont, the joint venture will extend employment and economic opportunities in the region much further than what each company could have done on its own. There is a reason Nevada is an attractive destination for mining investment and it’s not only because of the state’s mineral endowment. Here we also enjoy a fruitful, rewarding partnership with the state and federal government in growing a responsible, safe and productive industry for our local communities,” Bristow said.
Earlier in the day, Governor Sisolak visited the Cortez mine site, his first visit to a Tier One
9
mine. Cortez has been continuously mined since 1862 and demonstrates the magnitude of the industry in Northern Nevada as an economic driver for the state through the capital involved in running modern mining operations, environmental safeguards, employee safety, and job security.
 AUTOMATION: THE FUTURE OF MINING
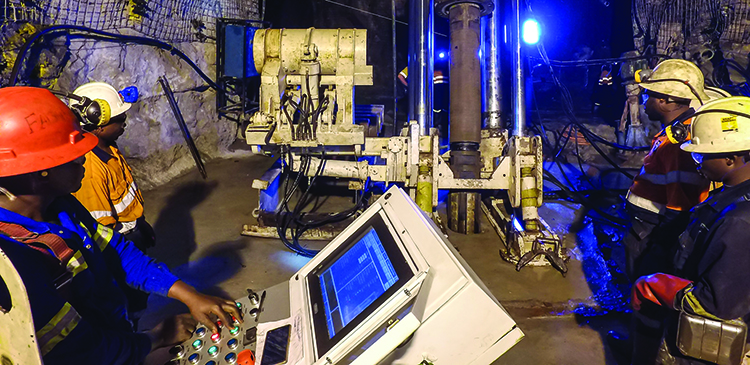
Kibali, the youngest mine in the Barrick stable, was designed for automated mining, and the successful system it has installed underground and is still refining, has made it a global leader in this field. This will now be used as the model for the digitalization of automated mining across the group.
The backbone of Kibali’s underground operation is Sandvik’s Automine Multi Fleetsystem, supervised on surface by a single operator. In a world first, it allows a fleet of up to five LHDs (Load, haul, dump machines) to be operated autonomously, 750m below the surface, within the same 6m x 6m production drive while utilizing designated passing bays to maintain traffic flow. A similar system is used in the production levels to feed the ore passes.
Another ambitious and world leading project being pioneered at the Nevada mines is surface haulage automation. Initially none of the Original Equipment Manufacturers (OEM) wanted to engage in the project, due to the mammoth task of retrofitting an autonomous system to a 20-year-old fleet of ultra-class trucks and the technological limitations that come with that age of machine. Barrick found another partner that specialized in autonomous solutions outside the mining industry and has now successfully completed a proof of concept (POC) utilizing five haulage units that have delivered over 5.5 million tonnes, faster than any other similar POC in the industry.
With the ongoing development of these and various other autonomous operating systems in Barrick, the vision is to integrate these pockets of success and progress in a state-of-the-art system where highly trained operators with a uniform skill set manage all the operations from surface or remote sites.
Glenn Heard, Barrick’s group executive for mining adds, “Barrick is also rolling out a single information system across its operations, including Nevada Gold Mines.”
President and chief executive Mark Bristow said access to real-time data integrated across the organization is an essential requirement for pro-active decision-making and management agility. “Real time data is key for the effective management of every function from parts procurement to predictive equipment maintenance,” says Bristow.
 BARRICK COMMITS TO DELIVERING MASSAWA FOR BENEFIT OF ALL STAKEHOLDERS
Barrick president and chief executive Mark Bristow has met Senegalese President Macky Sall to discuss how best to bring the Massawa gold project to account in partnership with the country’s government.
Massawa and its associated orebody, Sofia, were discovered by Randgold Resources, since merged with Barrick, which invested $96.2 million in a feasibility study. Subsequent to the original feasibility model, an update of reserve pricing to $1,200/oz resulted in a total Probable Mineral Reserve of 20.9Mt @ 3.94g/t for 2.6Moz as at December 31, 2018 (100% basis)
14
, with lower strip ratios and higher proportions of low cost ore fed to the plant, relative to the $1,000/oz Mineral Reserve.
The feasibility study also defined additional upside within Massawa’s $1,500/oz Mineral Resource base including an Indicated Mineral Resource of 23Mt @ 4.00g/t for 3.0Moz and an Inferred Mineral Resource of 6.3Mt @ 3.0g/t for 0.6Moz, as at December 31, 2018 (100% basis)
15
. Ongoing exploration in 2019 has identified additional opportunities to further add to the project inventory. The project’s environmental impact study has been approved and a mining permit application and plan have been submitted to the government.
Bristow says it is clear that Massawa offers enormous potential value to Barrick’s shareholders, future investors and its Senegalese stakeholders. It also represents an opportunity to further develop Senegal’s fledgling gold mining industry.
“Barrick is committed to delivering Massawa for the benefit of all stakeholders. We are now addressing how best to realize the full value of this asset in cooperation with the government,” he said.
Barrick, through Randgold, has invested $141 million in exploration in Senegal since 2002. In addition to Massawa, Barrick has a large exploration program adjacent to Senegal’s border with Mali and close to its Loulo-Gounkoto complex as part of its Bambadji joint venture.
 BARRICK BUILDS PLATFORM FOR NEW GROWTH IN LATIN AMERICA
The renewed commitment of Barrick to Latin America, designed to optimize its existing operations and create a platform for a next generation of mines, has made significant progress since its launch at the beginning of this year, says president and chief executive Mark Bristow.
Speaking at a meeting with local community leaders and media in San Juan, Argentina, Bristow said the company’s assets in the region were a major part of its global portfolio and there was enormous potential for new discoveries capable of amplifying Barrick’s ability to create real value for all its stakeholders.
“Barrick holds a highly prospective land package, with mining rights covering some 34,000 hectares, in the El Indio gold belt. This legendary gold province, which spans Argentina, Chile and Peru, has already yielded five significant discoveries and we believe its mineral wealth still offers a very substantial upside,” he said.
“We have a new regional exploration strategy that is being implemented by a best-in-class team drawn from the merged Barrick and Randgold. In Argentina alone, we plan to invest more than $30 million in exploration over the next two years.”
Turning to the operations, Bristow said the current expansion of Pueblo Viejo is expected to maintain the mine’s Tier One
9
status for years to come. At Veladero, work to reclaim its full potential and extend its life was already showing results, with the mine increasing production by 13,000 ounces (100% basis) in the second quarter relative to Q1. He noted that over the past 14 years Veladero had contributed some $8.9 billion to the Argentine economy through taxes, royalties, salaries and payments to local suppliers. In addition, the mine has established a new trust fund that could deliver more than $70 million in community infrastructure between 2020 and 2028, depending on production. At Pascua-Lama, the focus is on going back to basics in order to review the original project’s parameters and defining its future potential.
In Chile, the Norte Abierto and Alturas projects are progressing, while in Peru the Lagunas Norte mine is being placed on care and maintenance while the team assesses the sulphide resource potential, and at Pierina closure planning is continuing.
Bristow said Barrick acknowledged that there were legacy challenges in each of these countries. It was engaging with their governments and communities to resolve these and to build productive new partnerships with its hosts to ensure that the new value that is created benefits all stakeholders.
“We are an organization that has grown out of pioneering exploration, discoveries and development. Given our established presence here, our local geological knowledge and exploration skills, we are committed to becoming a leader in the region,” he said.
 KIBALI MARKS A DECADE OF VALUE CREATION IN THE DRC
The Kibali gold mine remains on track at the year’s halfway point to meet or beat its production forecast of 750,000 ounces for 2019, says Mark Bristow, president and chief executive of Barrick.
Speaking at a briefing for local media, Bristow said this year marked the 10th anniversary of the acquisition of the Moto project which since then has been developed into one of the largest gold mines in the world, contributing $2.7 billion to the Congolese economy in the process.
It is also now a full year since Kibali became the owner-operator of its underground mine, which ranks as one of the most advanced in the global industry in terms of automation. The system is currently being developed to the next technological level, where it will allow manned and unmanned operations within the same area.
Bristow said a significant feature of autonomous mining was that it had involved the transfer of specialist technical skills from expatriate instructors to Kibali’s Congolese workforce. More than 90% of Kibali’s 5,000 employees and contractors, including its management, are Congolese nationals.
It is also making a substantial contribution to the promotion of the local economy through its support of Congolese contractors and suppliers, which has turned the north-east of the country into a real commercial hub. During the first half of this year, Kibali paid some $79 million to its Congolese business partners. In addition, it continues to develop the infrastructure around the mine through initiatives such as the Durba asphalt project which is paving a section of the main national road to Uganda which runs through the town center. Ambitious agribusiness projects designed to deliver sustainable benefits to the local community are also being advanced.
“Ten years ago, we went to a remote part of Africa and found what we believed was a real world-class opportunity but one which would require a major investment as well as a lot of courage to develop. That opportunity became Kibali, which poured its first gold in September 2013 and ramped up to full production during 2018,” Bristow said.
“We invested in the DRC without any incentives provided by the government, only a clear and equitable mining code. Last year, however, the then government unilaterally imposed a new code which we believe puts the Congolese mining industry at risk and could discourage future investment. We continue to engage with the government on this issue, and were encouraged when the new President, his excellency Felix Tshisekedi, outlined his vision, of attracting foreign investment and developing the industry in a spirit of partnership, to Barrick’s executive chairman John Thornton at a meeting earlier this year. It is this partnership that enabled the creation of Kibali and supports Barrick’s search for new world-class gold deposits in the DRC.”
 BARRICK CALLS FOR PARTNERSHIP TO SECURE PORGERA'S FUTURE
Barrick president and chief executive Mark Bristow says his recent meeting with prime minister James Marape had served to confirm the need for a partnership approach to the future of the Porgera gold mine. This was Bristow’s second meeting with the recently elected prime minister and his third visit to Papua New Guinea (PNG) since he joined Barrick at the beginning of the year.
Porgera’s special mining lease expires this month and the government is currently considering an application for a 20-year extension by its operator, Barrick Niugini Limited, a joint venture between Barrick and Zijin Mining Group of China. Bristow said prime minister Marape’s view that PNG should receive a better share of the benefits generated by the development of its mineral resources was in line with Barrick’s own commitment to ensuring that the value created by its operations should reward all its stakeholders, especially its host governments and communities.
A productive and mutually rewarding partnership
“The people of PNG have a right to benefit from these resources and the government is their steward. The mining companies invest the capital and provide the expertise that makes profitable resource development possible. This common cause calls for a productive, mutually rewarding partnership between the miners and their hosts. Barrick has successfully established and maintained such relationships at its operations worldwide,” he said.
Bristow noted that Porgera was one of the largest mines in PNG and had been a key driver in its regional, provincial and national economies for the past 30 years.
Employing local people, encouraging local business
Over that time the mine has paid more than 4.3 billion Kina ($1.27 billion) in taxes and royalties to the government and has contributed, on average, approximately 10% of the country’s annual export income. It is one of the largest employers in the country, with more than 3,100 full-time PNG employees, 1,000 of them recruited in the Porgera region. It has spent 1.2 billion Kina ($353 million) with Porgera businesses, helping hundreds of them to grow. The Enga provincial government and Porgera landowners have also benefited directly from their part-ownership of the mine, earning more than 1 billion Kina ($294 million) in equity cash payments.
“Our presence here has also been a force for good in many other ways, and the development projects and education and training initiatives we have funded, including our donations, to the total value of 544 million Kina ($160 million) have provided schools, health services, water, power, bridges and roads, changing the lives of many for the better. The imminent reopening of the much-needed Paiam hospital in Porgera, made possible by the mine’s financial and technical support, is the most recent example of our commitment to the community,” Bristow said.
Local Paiam hospital being reopened
The Paiam hospital has been extensively refurbished. Since the hospital’s closure in 2017, Barrick Niugini Limited (BNL), which operates the Porgera mine, has joined the Enga Provincial Health Authority’s efforts to reinstate the much-needed facility, funding new equipment to the amount of more than Kina 1.9 million ($575 000). BNL also sourced and supplied the equipment, which was installed by the mine’s maintenance teams.
“Through BNL, Barrick and Zijin Mining will continue to work with the Enga Provincial Government to establish ongoing financial, technical and expertise support to ensure the sustainability of the hospital and the healthcare it provides to the people of the Porgera Valley,” said Bristow.
Bright future for Porgera
He said Barrick and its joint venture partner Zijin saw a bright future ahead for Porgera. It is a world-class gold deposit and with the right level of investment and appropriate mining technology combined with prudent management, there are opportunities to maintain and even increase production while continuing to curb costs.
“I also travelled to the mine, where I continued the discussions I had with government with our local stakeholders. I am confident that we shall be able to reach a broad agreement on the terms of the lease extension, and that we shall develop the kind of partnership that will ensure that Porgera continues to benefit the country and community for many years to come,” he said.
 COURT DECISION ALLOWS CONTINUED MINING AT PORGERA
The National Court of Papua New Guinea ruled on August 2
nd
that the provisions of the country’s 1992 Mining Act applied to the Porgera gold mine, thus allowing it to continue operating while the application to extend its Special Mining Lease is being considered. The current lease expires on August 16, 2019.
Porgera is operated by Barrick Niugini Limited, a joint venture between Barrick and Zijin Mining Company. At the time, Barrick president and chief executive Mark Bristow and Zijin executive director and senior vice-president George Fang were in Papua New Guinea to discuss the proposed extension with the government and the Porgera Special Mining Lease landowners.
Bristow and Fang welcomed the court’s ruling, saying it allowed for the continuation of their operations at Porgera post August 16
th
, which would enable the mine to continue delivering substantial benefits to communities and landowners in the Porgera Valley, as well as to the national and provincial governments, while the SML Extension was finalized. The ruling also confirmed that Porgera operated under the 1992 Mining Act and was entitled to seek an extension.
They noted that Porgera was one of the largest mines in PNG and had been a key driver in its regional, provincial and national economies for the past 30 years. Over that time, it has paid more than 4.3 billion Kina ($1.27 billion) in taxes and royalties to the government and has contributed, on average, 10% of the country’s export income. It is also one of the largest employers in the country, with more than 3,100 PNG employees. It has spent 1.2 billion Kina ($353 million) with local businesses and paid 1 billion Kina ($294 million) in equity cash to the Enga provincial government and Porgera landowners, who are part-owners of the mine.
 TWO DECADES OF VALUE DELIVERY AND PARTNERSHIP IN MALI
Twenty years after Morila started production, the Barrick owned and operated gold mines in Mali continue to make a major contribution to the country’s economy and lead the growth of its mining industry, says president and chief executive Mark Bristow.
Speaking at a recent briefing at the mine for local media, Bristow said while Morila was heading for closure after producing 6.8 million ounces of gold, the Loulo-Gounkoto complex ranked as one of the world’s top 10 Tier One
9
gold mines and during the past quarter again delivered the greatest production improvement in Barrick’s global portfolio. In total, Randgold and its successor have spent $160 million on exploration and contributed approximately $6.5 billion to the greater economy with taxes, royalties and dividends totaling $2.6 billion. The company’s contribution represented approximately 6% of Mali’s GDP in 2018. Bristow noted that the government and Barrick’s Mali management team had made progress in resolving outstanding tax disputes and the company expected to conclude the agreed mediation process soon.
At the year’s halfway mark, he said, Loulo-Gounkoto was well on its way to achieve its 2019 production guidance of 690,000 ounces of gold
16
. Continuing brownfields exploration around its three main orebodies was confirming the potential to replace depleted reserves, supporting and possibly extending the complex’s 10-year plan. Barrick is also hunting new orebodies along its 70-kilometer tenement straddling the Mali-Senegal shear, which has produced more major gold discoveries over the past 20 years than anywhere else in the world.
The Loulo-Gounkoto complex currently comprises the Yalea and Gara underground mines and the Gounkoto super pit, with a fourth mine in the form of an underground operation at Gounkoto at the feasibility study stage.
The installation of a 20-megawatt solar power plant is currently under way. Bristow said this would save the complex 10 million liters of fuel per year, reduce its carbon footprint and provide a low-cost power source for the local community after Loulo-Gounkoto’s eventual closure.
In other community projects, the agricultural college established by the complex has produced its third batch of graduates, all of whom have been placed with agribusinesses. Nineteen schools, one for each village, have been built and enrolment has increased to more than 5,000 against 500 when the mine opened. Three clinics have been established in the community and programs to fight malaria and HIV/AIDS continue to reduce the incidence of these diseases.
To date, Loulo-Gounkoto has invested more than $6.4 million in community development. At Morila meanwhile, the agribusiness center designed to leave a sustainable post-mining economy for the local community is taking its final shape.
Bristow noted that all three mines at Loulo-Gounkoto were managed by Malian nationals. Of the complex’s more than 4,000 employees, 95% are Malians.
“The Barrick mines have been good for Mali, not only in terms of their contribution to the economy but also for their world-class health, safety and environmental practices, their substantial investment in sustainability, their support of local suppliers and contractors, and their policy of employing and empowering Malian citizens. For their part, Mali and its people have been rewarding hosts and partners, and we look forward to continuing our productive relationship with them,” he said.
 BARRICK LOOKS TO THE FUTURE IN CÔTE D’IVOIRE
Barrick is actively seeking to extend the life of its Tongon gold mine while at the same time exploring new opportunities elsewhere in Côte d’Ivoire, says president and chief executive Mark Bristow.
Speaking at a briefing for local media visiting the mine, Bristow noted that Tongon was now in its 10th year of operations while its developer Randgold Resources, since merged with Barrick, had been involved in Côte d’Ivoire for more than 20 years, spending in excess of $90 million (CFA 52 billion) on exploration alone during that time.
“Tongon was discovered and developed in the midst of a civil war and since then has had to contend with almost every conceivable challenge including social and political unrest in the region, a protracted work stoppage and an erratic power supply. Thanks to a committed and courageous management team - comprised almost entirely of Ivorian nationals - the mine has nevertheless been consistently profitable, delivering significant value to all its stakeholders and pointing the way for the growth of the country’s mining industry and economy,” Bristow said.
“On current reserves, Tongon has under three years of life left, but we hope to extend that by converting near-mine resources to reserves, exploring the potential of satellite deposits and probing targets along the Badenou trend in the Tongon lease area. We are also seeking to advance the agribusiness projects designed to provide economic opportunity and food security for the local community after the mine’s closure.”
Elsewhere in Côte d’Ivoire, extensive exploration work is under way on all the permits within the company’s large portfolio, which covers the most prospective parts of the country. Bristow said the success of this program depended in part on the government’s continued support in the processing of applications and facilitating access to permits. He added that since the President had appointed a dedicated Minister of Mines, there had been a significant change in how the government was working with the industry to address key issues that had proved to be impediments in the past.
Turning to the mine’s current performance, Bristow said Tongon had rebuilt the capacity compromised by last year’s extended work stoppages, and at the halfway stage of 2019 was on track to achieve its production target of approximately 290,000 ounces of gold. Its continuing engagement with the government and the national power utility has resulted in a significant improvement in the stability of the power supply on the back of the expansion of the regional infrastructure. It is also maintaining a positive industrial relations climate on the mine.
The mine’s safety record remains exemplary and to date it has worked more than 8.7 million Lost-Time Injury-Free Hours. Its safety and environmental certifications have been renewed and its water management has improved further. In conjunction with an NGO, Tongon continues effectively to manage public health on the mine and in the surrounding community through malaria and HIV/AIDS prevention programs.

Appendix 1
2019 Operating and Capital Expenditure Guidance
|
GOLD PRODUCTION AND COSTS
|
|
|
2019 forecast production (000s ozs)
|
2019 forecast cost of sales
6
($/oz)
|
2019 forecast total cash costs
7
($/oz)
|
2019 forecast all-in sustaining costs
7
($/oz)
|
|
Carlin
17,18
|
960 - 1,020
|
1,020 - 1,080
|
740 - 790
|
955 - 995
|
|
Cortez
17
|
760 - 810
|
810 - 850
|
530 - 580
|
670 - 710
|
|
Turquoise Ridge/Twin Creeks
17
|
330 - 370
|
655 - 705
|
550 - 600
|
680 - 730
|
|
Phoenix
17
|
50 - 70
|
1,290 - 1,330
|
940 - 990
|
1,120 - 1,150
|
|
Long Canyon
17
|
40 - 50
|
720 - 750
|
300 - 350
|
920 - 950
|
|
Pueblo Viejo (60%)
|
550 - 600
|
780 - 830
|
465 - 510
|
610 - 650
|
|
Loulo-Gounkoto (80%)
|
520 - 570
|
880 - 930
|
575 - 625
|
810 - 850
|
|
Kibali (45%)
|
330 - 350
|
1,150 - 1,200
|
555 - 605
|
670 - 730
|
|
Kalgoorlie (50%)
|
260 - 280
|
920 - 970
|
740 - 790
|
1,010 - 1,050
|
|
Tongon (89.7%)
|
250 - 270
|
1,300 - 1,350
|
710 - 760
|
780 - 820
|
|
Porgera (47.5%)
|
240 - 260
|
980 - 1,030
|
800 - 850
|
985 - 1,025
|
|
Veladero (50%)
|
230 - 250
|
1,250 - 1,350
|
770 - 820
|
1,150 - 1,250
|
|
Hemlo
|
200 - 220
|
890 - 940
|
765 - 815
|
1,100 - 1,200
|
|
Acacia (63.9%)
|
320 - 350
|
920 - 970
|
665 - 710
|
860 - 920
|
|
Other Sites
19
|
120 - 160
|
1,155 - 1,240
|
895 - 945
|
1,055 - 1,115
|
|
Total Attributable to Barrick
20,21,22
|
5,100 - 5,600
|
910 - 970
|
650 - 700
|
870 - 920
|
|
COPPER PRODUCTION AND COSTS
|
|
|
2019 forecast production (millions lbs)
|
2019 forecast cost of sales
6
($/lb)
|
2019 forecast C1 cash costs
8
($/lb)
|
2019 forecast all-in sustaining costs
8
($/lb)
|
|
Lumwana
|
210 - 240
|
2.25 - 2.50
|
1.80 - 2.10
|
2.75 - 3.15
|
|
Zaldívar (50%)
|
120 - 130
|
2.40 - 2.70
|
1.65 - 1.85
|
2.00 - 2.20
|
|
Jabal Sayid (50%)
|
45 - 60
|
2.00 - 2.30
|
1.60 - 1.90
|
1.60 - 1.90
|
|
Total Copper
22
|
375 - 430
|
2.30 - 2.70
|
1.70 - 2.00
|
2.40 - 2.90
|
|
CAPITAL EXPENDITURES
|
|
|
|
($ millions)
|
|
Mine site sustaining
|
1,100 - 1,300
|
|
Project
|
300 - 400
|
|
Total attributable capital expenditures
5
|
1,400 - 1,700
|
Appendix 2
Production and Cost Summary
Production and Cost Summary - Gold
|
|
For the three months ended
|
|
|
6/30/19
|
3/31/19
|
% Change
|
6/30/18
|
% Change
|
|
Barrick Nevada
a
|
|
|
|
|
|
|
Gold produced (000s oz)
|
526
|
|
572
|
|
8
|
%
|
533
|
|
1
|
%
|
|
Cost of sales ($/oz)
|
842
|
780
|
|
8
|
%
|
845
|
|
0
|
%
|
|
Total cash costs ($/oz)
b
|
594
|
|
542
|
|
10
|
%
|
553
|
|
7
|
%
|
|
All-in sustaining costs ($/oz)
b
|
752
|
|
678
|
|
11
|
%
|
725
|
|
4
|
%
|
|
Cortez
|
|
|
|
|
|
|
Gold produced (000s oz)
|
280
|
|
262
|
|
7
|
%
|
294
|
|
5
|
%
|
|
Cost of sales ($/oz)
|
719
|
|
682
|
|
5
|
%
|
653
|
|
10
|
%
|
|
Total cash costs ($/oz)
b
|
489
|
|
433
|
|
13
|
%
|
352
|
|
39
|
%
|
|
All-in sustaining costs ($/oz)
b
|
561
|
|
506
|
|
11
|
%
|
437
|
|
28
|
%
|
|
Goldstrike
c
|
|
|
|
|
|
|
Gold produced (000s oz)
|
181
|
|
233
|
|
22
|
%
|
170
|
|
6
|
%
|
|
Cost of sales ($/oz)
|
1,116
|
|
947
|
|
18
|
%
|
1,199
|
|
7
|
%
|
|
Total cash costs ($/oz)
b
|
769
|
|
671
|
|
15
|
%
|
856
|
|
10
|
%
|
|
All-in sustaining costs ($/oz)
b
|
1,088
|
|
891
|
|
22
|
%
|
1,220
|
|
11
|
%
|
|
Turquoise Ridge (75%)
|
|
|
|
|
|
|
Gold produced (000s oz)
|
65
|
|
77
|
|
16
|
%
|
69
|
|
6
|
%
|
|
Cost of sales ($/oz)
|
665
|
|
592
|
|
12
|
%
|
802
|
|
17
|
%
|
|
Total cash costs ($/oz)
b
|
569
|
|
506
|
|
12
|
%
|
692
|
|
18
|
%
|
|
All-in sustaining costs ($/oz)
b
|
667
|
|
592
|
|
13
|
%
|
757
|
|
12
|
%
|
|
Pueblo Viejo (60%)
|
|
|
|
|
|
|
Gold produced (000s oz)
|
124
|
|
148
|
|
16
|
%
|
123
|
|
1
|
%
|
|
Cost of sales ($/oz)
|
852
|
|
696
|
|
22
|
%
|
852
|
|
0
|
%
|
|
Total cash costs ($/oz)
b
|
557
|
|
421
|
|
32
|
%
|
524
|
|
6
|
%
|
|
All-in sustaining costs ($/oz)
b
|
702
|
|
543
|
|
29
|
%
|
690
|
|
2
|
%
|
|
Loulo-Gounkoto (80%)
d
|
|
|
|
|
|
|
Gold produced (000s oz)
|
147
|
|
128
|
15
|
%
|
|
|
|
Cost of sales ($/oz)
|
1,072
|
|
1,052
|
|
2
|
%
|
|
|
|
Total cash costs ($/oz)
b
|
598
|
|
684
|
|
13
|
%
|
|
|
|
All-in sustaining costs ($/oz)
b
|
811
|
|
840
|
|
3
|
%
|
|
|
|
Kibali (45%)
d
|
|
|
|
|
|
|
Gold produced (000s oz)
|
95
|
|
93
|
|
2
|
%
|
|
|
|
Cost of sales ($/oz)
|
868
|
|
1,202
|
|
28
|
%
|
|
|
|
Total cash costs ($/oz)
b
|
540
|
|
573
|
|
6
|
%
|
|
|
|
All-in sustaining costs ($/oz)
b
|
651
|
|
673
|
|
3
|
%
|
|
|
|
Kalgoorlie (50%)
|
|
|
|
|
|
|
Gold produced (000s oz)
|
57
|
55
|
4
|
%
|
96
|
41
|
%
|
|
Cost of sales ($/oz)
|
1,038
|
|
1,064
|
|
2
|
%
|
833
|
|
25
|
%
|
|
Total cash costs ($/oz)
b
|
846
|
|
870
|
|
3
|
%
|
672
|
|
26
|
%
|
|
All-in sustaining costs ($/oz)
b
|
1,204
|
|
1,185
|
|
2
|
%
|
763
|
|
58
|
%
|
|
Tongon (89.7%)
d
|
|
|
|
|
|
|
Gold produced (000s oz)
|
61
|
61
|
0
|
%
|
|
|
|
Cost of sales ($/oz)
|
1,562
|
|
1,451
|
|
8
|
%
|
|
|
|
Total cash costs ($/oz)
b
|
750
|
|
799
|
|
6
|
%
|
|
|
|
All-in sustaining costs ($/oz)
b
|
802
|
|
836
|
|
4
|
%
|
|
|
Production and Cost Summary - Gold (continued)
|
|
For the three months ended
|
|
|
6/30/19
|
3/31/19
|
% Change
|
6/30/18
|
% Change
|
|
Porgera (47.5%)
|
|
|
|
|
|
|
Gold produced (000s oz)
|
61
|
66
|
(8
|
)%
|
41
|
49
|
%
|
|
Cost of sales ($/oz)
|
1,032
|
|
1,031
|
|
0
|
%
|
1,233
|
|
(16
|
)%
|
|
Total cash costs ($/oz)
b
|
893
|
|
854
|
|
5
|
%
|
846
|
|
6
|
%
|
|
All-in sustaining costs ($/oz)
b
|
1,112
|
|
978
|
|
14
|
%
|
1,183
|
|
(6
|
)%
|
|
Veladero (50%)
|
|
|
|
|
|
|
Gold produced (000s oz)
|
75
|
|
70
|
|
7
|
%
|
78
|
|
(4
|
)%
|
|
Cost of sales ($/oz)
|
1,186
|
|
1,195
|
|
(1
|
)%
|
984
|
|
21
|
%
|
|
Total cash costs ($/oz)
b
|
746
|
|
713
|
|
5
|
%
|
534
|
|
40
|
%
|
|
All-in sustaining costs ($/oz)
b
|
1,046
|
|
1,100
|
|
(5
|
)%
|
946
|
|
11
|
%
|
|
Hemlo
|
|
|
|
|
|
|
Gold produced (000s oz)
|
55
|
55
|
0
|
%
|
38
|
45
|
%
|
|
Cost of sales ($/oz)
|
953
|
|
906
|
|
5
|
%
|
1,277
|
|
(25
|
)%
|
|
Total cash costs ($/oz)
b
|
822
|
|
769
|
|
7
|
%
|
1,184
|
|
(31
|
)%
|
|
All-in sustaining costs ($/oz)
b
|
1,015
|
|
915
|
|
11
|
%
|
1,453
|
|
(30
|
)%
|
|
Acacia (63.9%)
|
|
|
|
|
|
|
Gold produced (000s oz)
|
101
|
67
|
51
|
%
|
86
|
17
|
%
|
|
Cost of sales ($/oz)
|
920
|
|
1,114
|
|
(17
|
)%
|
877
|
|
5
|
%
|
|
Total cash costs ($/oz)
b
|
659
|
|
850
|
|
(22
|
)%
|
688
|
|
(4
|
)%
|
|
All-in sustaining costs ($/oz)
b
|
792
|
|
1,023
|
|
(23
|
)%
|
918
|
|
(14
|
)%
|
|
Lagunas Norte
|
|
|
|
|
|
|
Gold produced (000s oz)
|
39
|
35
|
11
|
%
|
65
|
(40
|
)%
|
|
Cost of sales ($/oz)
|
952
|
|
1,304
|
|
(27
|
)%
|
657
|
|
45
|
%
|
|
Total cash costs ($/oz)
b
|
732
|
|
637
|
|
15
|
%
|
428
|
|
71
|
%
|
|
All-in sustaining costs ($/oz)
b
|
998
|
|
1,018
|
|
(2
|
)%
|
662
|
|
51
|
%
|
|
Golden Sunlight
|
|
|
|
|
|
|
Gold produced (000s oz)
|
6
|
7
|
(14
|
)%
|
7
|
(14
|
)%
|
|
Cost of sales ($/oz)
|
2,336
|
|
2,174
|
|
7
|
%
|
1,879
|
|
24
|
%
|
|
Total cash costs ($/oz)
b
|
2,037
|
|
1,974
|
|
3
|
%
|
1,928
|
|
6
|
%
|
|
All-in sustaining costs ($/oz)
b
|
2,434
|
|
2,471
|
|
(1
|
)%
|
2,138
|
|
14
|
%
|
|
Morila (40%)
d
|
|
|
|
|
|
|
Gold produced (000s oz)
|
6
|
10
|
(40
|
)%
|
|
|
|
Cost of sales ($/oz)
|
2,585
|
|
1,445
|
|
79
|
%
|
|
|
|
Total cash costs ($/oz)
b
|
1,446
|
|
1,157
|
|
25
|
%
|
|
|
|
All-in sustaining costs ($/oz)
b
|
1,449
|
|
1,157
|
|
25
|
%
|
|
|
|
Total Attributable to Barrick
|
|
|
|
|
|
|
Gold produced (000s oz)
|
1,353
|
|
1,367
|
|
(1
|
)%
|
1,067
|
|
27
|
%
|
|
Cost of sales ($/oz)
e
|
964
|
|
947
|
|
2
|
%
|
882
|
|
9
|
%
|
|
Total cash costs ($/oz)
b
|
651
|
|
631
|
|
3
|
%
|
605
|
|
8
|
%
|
|
All-in sustaining costs ($/oz)
b
|
869
|
|
825
|
|
5
|
%
|
856
|
|
2
|
%
|
-
Represents the combined results of Cortez, Goldstrike (including our 60% share of South Arturo) and, starting in the first quarter of 2019, our 75% interest in Turquoise Ridge.
-
These are non-GAAP financial performance measures with no standardized meaning under IFRS and therefore may not be comparable to similar measures presented by other issuers. For further information and a detailed reconciliation of each non-GAAP measure used in this press release to the most directly comparable IFRS measure, please see endnote 7.
-
Includes production and sales from South Arturo on a 60% basis, which reflects our equity share.
-
These sites did not form a part of the Barrick consolidated results in the three months ended June 30, 2018 as these sites were acquired as a result of the Merger.
-
Cost of sales per ounce (Barrick’s share) is calculated as cost of sales - gold on an attributable basis (excluding Pierina) divided by gold equity ounces sold.
Production and Cost Summary - Copper
|
|
For the three months ended
|
|
|
June 30, 2019
|
March 31, 2019
|
% Change
|
6/30/18
|
% Change
|
|
Lumwana
|
|
|
|
|
|
|
Copper production (millions lbs)
|
49
|
61
|
(20
|
)%
|
47
|
4
|
%
|
|
Cost of sales ($/lb)
|
2.07
|
|
2.16
|
|
(4
|
)%
|
2.43
|
|
(15
|
)%
|
|
C1 cash cash costs ($/lb)
a
|
1.70
|
|
1.67
|
|
2
|
%
|
2.16
|
|
(21
|
)%
|
|
All-in sustaining costs ($/lb)
a
|
2.78
|
|
2.79
|
|
0
|
%
|
3.13
|
|
(11
|
)%
|
|
Zaldívar (50%)
|
|
|
|
|
|
|
Copper production (millions lbs)
|
32
|
28
|
14
|
%
|
23
|
|
39
|
%
|
|
Cost of sales ($/lb)
|
2.32
|
|
2.68
|
|
(13
|
)%
|
2.69
|
|
(14
|
)%
|
|
C1 cash cash costs ($/lb)
a
|
1.61
|
|
1.91
|
|
(16
|
)%
|
2.19
|
|
(26
|
)%
|
|
All-in sustaining costs ($/lb)
a
|
1.85
|
|
2.12
|
|
(13
|
)%
|
2.64
|
|
(30
|
)%
|
|
Jabal Sayid (50%)
|
|
|
|
|
|
|
Copper production (millions lbs)
|
16
|
17
|
(6
|
)%
|
13
|
23
|
%
|
|
Cost of sales ($/lb)
|
1.45
|
|
1.55
|
|
(6
|
)%
|
1.84
|
|
(21
|
)%
|
|
C1 cash cash costs ($/lb)
a
|
1.22
|
|
1.10
|
|
11
|
%
|
1.50
|
|
(19
|
)%
|
|
All-in sustaining costs ($/lb)
a
|
1.31
|
|
1.30
|
|
1
|
%
|
2.30
|
|
(43
|
)%
|
|
Total Copper
|
|
|
|
|
|
|
Copper production (millions lbs)
|
97
|
|
106
|
|
(8
|
)%
|
83
|
17
|
%
|
|
Cost of sales ($/lb)
b
|
2.04
|
|
2.21
|
|
(8
|
)%
|
2.45
|
|
(17
|
)%
|
|
C1 cash cash costs ($/lb)
a
|
1.59
|
|
1.66
|
|
(4
|
)%
|
2.10
|
|
(24
|
)%
|
|
All-in sustaining costs ($/lb)
a
|
2.28
|
|
2.46
|
|
(7
|
)%
|
3.04
|
|
(25
|
)%
|
-
These are non-GAAP financial performance measures with no standardized meaning under IFRS and therefore may not be comparable to similar measures presented by other issuers. For further information and a detailed reconciliation of each non-GAAP measure used in this press release to the most directly comparable IFRS measure, please see endnote 8.
-
Cost of sales per pound (Barrick’s share) is calculated as cost of sales - copper plus our equity share of cost of sales attributable to Zaldívar and Jabal Sayid divided by copper pounds sold.
Appendix 3
2019 Outlook Assumptions and Economic Sensitivity Analysis
23
|
|
2019 Guidance Assumption
|
Hypothetical Change
|
Impact on EBITDA (millions)
|
Impact on AISC
7,8
|
|
Gold revenue, net of royalties
|
$1,250/oz
|
+/- $100/oz
|
+/- $ 253
|
+/- $ 4/oz
|
|
Copper revenue, net of royalties
|
$2.75/lb
|
+/- $0.50/lb
|
+/- $ 91
|
+/- $ 0.04/lb
|
|
Gold all-in sustaining costs
7
|
|
|
|
|
|
WTI crude oil price
24
|
$65/bbl
|
+/- $10/bbl
|
+/- $ 20
|
+/- $ 8/oz
|
|
Australian dollar exchange rate
|
0.75:1
|
+/- 10%
|
+/- $ 13
|
+/- $ 5/oz
|
|
Argentine peso exchange rate
|
46:1
|
+/- 10%
|
+/- $ 4
|
+/- $ 2/oz
|
|
Canadian dollar exchange rate
|
1.30:1
|
+/- 10%
|
+/- $ 15
|
+/- $ 6/oz
|
|
European euro exchange rate
|
1.15:1
|
+/- 10%
|
+/- $ 1
|
+/- $ 0/oz
|
|
Copper all-in sustaining costs
8
|
|
|
|
|
|
WTI crude oil price
|
$65/bbl
|
+/- $10/bbl
|
+/- $ 3
|
+/- $ 0.02/lb
|
|
Chilean peso exchange rate
|
650:1
|
+/- 10%
|
+/- $ 5
|
+/- $ 0.03/lb
|
Technical Information
The scientific and technical information contained in this press release has been reviewed and approved by Steven Yopps, MMSA, Director - Metallurgy, North America; Chad Yuhasz, P.Geo, Mineral Resource Manager, Latin America and Australia Pacific; Simon Bottoms, CGeol, MGeol, FGS, MAusIMM, Mineral Resources Manager, Africa and Middle East; Rodney Quick, MSc, Pr. Sci.Nat, Mineral Resource Management and Evaluation Executive; John Steele, CIM, Metallurgy, Engineering and Capital Projects Executive; and Rob Krcmarov, FAusIMM, Executive Vice President, Exploration and Growth — each a “Qualified Person” as defined in National Instrument 43-101 –
Standards of Disclosure for Mineral Projects
.
Endnotes
Endnote 1
“Adjusted net earnings” and “adjusted net earnings per share” are non-GAAP financial performance measures. Adjusted net earnings excludes the following from net earnings: certain impairment charges (reversals) related to intangibles, goodwill, property, plant and equipment, and investments; gains (losses) and other one-time costs relating to acquisitions or dispositions; foreign currency translation gains (losses); significant tax adjustments not related to current period earnings; unrealized gains (losses) on non-hedge derivative instruments; and the tax effect and non-controlling interest of these items. The Company uses this measure internally to evaluate our underlying operating performance for the reporting periods presented and to assist with the planning and forecasting of future operating results. Barrick believes that adjusted net earnings is a useful measure of our performance because these adjusting items do not reflect the underlying operating performance of our core mining business and are not necessarily indicative of future operating results. Adjusted net earnings and adjusted net earnings per share are intended to provide additional information only and do not have any standardized meaning under IFRS and may not be comparable to similar measures of performance presented by other companies. They should not be considered in isolation or as a substitute for measures of performance prepared in accordance with IFRS. Further details on these non-GAAP measures are provided in the MD&A accompanying Barrick’s financial statements filed from time to time on SEDAR at www.sedar.com and on EDGAR at
www.sec.gov
.
Reconciliation of Net Earnings to Net Earnings per Share, Adjusted Net Earnings and Adjusted Net Earnings per Share
| ($ millions, except per share amounts in dollars)
|
|
For the three months ended
|
For the six months ended
|
|
6/30/19
|
3/31/19
|
6/30/19
|
6/30/19
|
6/30/18
|
|
Net earnings (loss) attributable to equity holders of the Company
|
111
|
194
|
(94)
|
305
|
64
|
|
Impairment charges related to intangibles, goodwill, property, plant and equipment, and investments
a
|
12
|
3
|
59
|
15
|
61
|
|
Acquisition/disposition (gains) losses
b
|
(12)
|
0
|
(2)
|
(12)
|
(48)
|
|
Foreign currency translation losses (gains)
|
(6)
|
22
|
75
|
16
|
90
|
|
Significant tax adjustments
c
|
(83)
|
8
|
16
|
(75)
|
62
|
|
Other expense (income) adjustments
d
|
58
|
47
|
43
|
105
|
37
|
|
Unrealized (gains) losses on non-hedge derivative instruments
|
0
|
(1)
|
0
|
(1)
|
0
|
|
Tax effect and non-controlling interest
|
(9)
|
(6)
|
(16)
|
(15)
| (15)
|
|
Adjusted net earnings
|
154
|
(184)
|
81
|
338
|
251
|
|
Net earnings per share
e
|
0.11
|
0.06
|
(0.08)
|
0.17
|
0.05
|
|
Adjusted net earnings per share
e
|
0.09
|
0.11
|
0.07
|
0.19
|
0.22
|
-
Net impairment charges for the three and six month periods ended June 30, 2018 primarily relate to the Kabanga project (a joint venture between Barrick and Glencore) and Acacia's Nyanzaga project in Tanzania.
-
Disposition gains primarily relate to the gain on the sale of a non-core royalty asset at Acacia for the six month period ended June 30, 2018.
-
Significant tax adjustments for the three and six months ended June 30, 2019 primarily relate to an adjustment to deferred taxes at Veladero. For the six months ended June 30, 2018, significant tax adjustments primarily relate to a tax audit of Pueblo Viejo in the Dominican Republic.
-
Other expense adjustments for the three and six month periods ended June 30, 2019 primarily relate to severance costs as a result of the implementation of a number of organizational reductions, the impact of changes in the discount rate assumptions on our closed mine rehabilitation provision and transaction costs related to Nevada Gold Mines.
-
Calculated using weighted average number of shares outstanding under the basic method of earnings per share.
Endnote 2
Includes Acacia on a 63.9% basis, Pueblo Viejo on a 60% basis, South Arturo on a 60% basis and Veladero on a 50% basis, which reflects our equity share of production and sales. Also includes Loulo-Gounkoto on an 80% basis, Kibali on a 45% basis, Tongon on an 89.7% basis and Morila on an 40% basis, which reflects our equity share of production and sales, commencing January 1, 2019, the effective date of the merger with Randgold.
Endnote 3
Realized price is a non-GAAP financial measure which excludes from sales: unrealized gains and losses on non-hedge derivative contracts; unrealized mark-to-market gains and losses on provisional pricing from copper and gold sales contracts; sales attributable to ore purchase arrangements; treatment and refining charges; and export duties. This measure is intended to enable Management to better understand the price realized in each reporting period for gold and copper sales because unrealized mark-to-market values of non-hedge gold and copper derivatives are subject to change each period due to changes in market factors such as market and forward gold and copper prices, so that prices ultimately realized may differ from those recorded. The exclusion of such unrealized mark-to-market gains and losses from the presentation of this performance measure enables investors to understand performance based on the realized proceeds of selling gold and copper production. The realized price measure is intended to provide additional information and does not have any standardized definition under IFRS and should not be considered in isolation or as a substitute for measures of performance prepared in accordance with IFRS. Further details on these non-GAAP measures are provided in the MD&A accompanying Barrick’s financial statements filed from time to time on SEDAR at www.sedar.com and on EDGAR at www.sec.gov
.
Reconciliation of Sales to Realized Price per ounce/pound
|
($ millions, except per ounce/pound information in dollars)
|
Gold
|
Copper
|
Gold
|
Copper
|
|
|
For the three months ended
|
For the six months ended
|
|
|
6/30/19
|
3/31/19
|
6/30/18
|
6/30/19
|
3/31/19
|
6/30/18
|
6/30/19
|
6/30/18
|
6/30/19
|
6/30/18
|
|
Sales
|
1,937
|
|
1,906
|
|
1,562
|
|
103
|
|
163
|
|
112
|
|
3,843
|
|
3,205
|
|
266
|
|
223
|
|
|
Sales applicable to non-controlling interests
|
(240
|
)
|
(224
|
)
|
(171
|
)
|
0
|
|
0
|
|
0
|
|
(464
|
)
|
(358
|
)
|
0
|
|
0
|
|
|
Sales applicable to equity method investments
a,b
|
135
|
|
129
|
|
0
|
|
124
|
|
121
|
|
87
|
|
264
|
|
0
|
|
245
|
|
200
|
|
|
Realized non-hedge gold/copper derivative (losses) gains
|
1
|
|
0
|
|
2
|
|
0
|
|
0
|
|
0
|
|
1
|
|
2
|
|
0
|
|
0
|
|
|
Sales applicable to Pierina
c
|
(26
|
)
|
(26
|
)
|
(32
|
)
|
0
|
|
0
|
|
0
|
|
(52
|
)
|
(61
|
)
|
0
|
|
0
|
|
|
Treatment and refinement charges
|
0
|
|
0
|
|
1
|
|
25
|
|
31
|
|
29
|
|
0
|
|
1
|
|
56
|
|
60
|
|
|
Revenues – as adjusted
|
1,807
|
|
1,785
|
|
1,362
|
|
252
|
|
315
|
|
228
|
|
3,592
|
|
2,789
|
|
567
|
|
483
|
|
|
Ounces/pounds sold (000s ounces/millions pounds)
c
|
1,372
|
|
1,365
|
|
1,037
|
|
96
|
|
103
|
|
74
|
|
2,737
|
|
2,108
|
|
199
|
|
159
|
|
|
Realized gold/copper price per ounce/pound
d
|
1,317
|
|
1,307
|
|
1,313
|
|
2.62
|
|
3.07
|
|
3.11
|
|
1,312
|
|
1,323
|
|
2.85
|
|
3.04
|
|
-
Represents sales of $125 million and $242 million, respectively, for the three and six month periods ended June 30, 2019 (March 31, 2019: $117 million and June 30, 2018: $nil and $nil, respectively) applicable to our 45% equity method investment in Kibali of $10 million and $22 million, respectively (March 31, 2019: $12 million and June 30, 2018: $nil and $nil, respectively) applicable to our 40% equity method investment in Morila for gold. Represents sales of $86 million and $167 million, respectively, for the three and six months ended June 30, 2019 (March 31, 2019: $81 million and June 30, 2018: $69 million and $142 million, respectively) applicable to our 50% equity method investment in Zaldívar and $44 million and $88 million, respectively (March 31, 2019: $44 million and June 30, 2018: $25 million and $66 million, respectively) applicable to our 50% equity method investment in Jabal Sayid for copper.
-
Sales applicable to equity method investments are net of treatment and refinement charges.
-
Figures exclude Pierina from the calculation of realized price per ounce as the mine is mining incidental ounces as it enters closure.
-
Realized price per ounce/pound may not calculate based on amounts presented in this table due to rounding.
Endnote 4
“Free cash flow” is a non-GAAP financial performance measure which deducts capital expenditures from net cash provided by operating activities. Barrick believes this to be a useful indicator of our ability to operate without reliance on additional borrowing or usage of existing cash. Free cash flow is intended to provide additional information only and does not have any standardized meaning under IFRS and may not be comparable to similar measures of performance presented by other companies. Free cash flow should not be considered in isolation or as a substitute for measures of performance prepared in accordance with IFRS. Further details on this non-GAAP measure are provided in the MD&A accompanying Barrick’s financial statements filed from time to time on SEDAR at www.sedar.com and on EDGAR at www.sec.gov.
Reconciliation of Net Cash Provided by Operating Activities to Free Cash Flow
| ($ millions)
|
|
For the three months ended
|
For the six months ended
|
|
6/30/19
|
3/31/19
|
6/30/19
|
6/30/19
|
6/30/18
|
|
Net cash provided by operating activities
|
434
|
520
|
141
|
954
|
648
|
|
Capital expenditures
|
(379)
|
(374)
|
(313)
|
(753)
|
(639)
|
|
Free cash flow
|
55
|
146
|
(172)
|
201
|
9
|
Endnote 5
These amounts are presented on the same basis as our guidance and include our 60% share of Pueblo Viejo and South Arturo, our 63.9% share of Acacia and our 50% share of Zaldívar and Jabal Sayid. Also includes our 80% share of Loulo-Gounkoto, 89.7% share of Tongon, 45% share of Kibali and 40% share of Morila, commencing January 1, 2019, the effective date of the Merger.
Endnote 6
Cost of sales applicable to gold per ounce is calculated using cost of sales applicable to gold on an attributable basis (removing the non-controlling interest of 40% Pueblo Viejo, 36.1% Acacia and 40% South Arturo from cost of sales), divided by attributable gold ounces sold. The non-controlling interest of 20% Loulo-Gounkoto and 10.3% of Tongon is also removed from cost of sales and our proportionate share of cost of sales attributable to equity method investments (Kibali and Morila) is included commencing January 1, 2019, the effective date of the Merger. Cost of sales applicable to copper per pound is calculated using cost of sales applicable to copper including our proportionate share of cost of sales attributable to equity method investments (Zaldívar and Jabal Sayid), divided by consolidated copper pounds sold (including our proportionate share of copper pounds sold from our equity method investments).
Endnote 7
“Total cash costs” per ounce and “All-in sustaining costs” per ounce are non-GAAP financial performance measures. “Total cash costs” per ounce starts with cost of sales applicable to gold production, but excludes the impact of depreciation, the non-controlling interest of cost of sales, and includes by-product credits. “All-in sustaining costs” per ounce begin with “Total cash costs” per ounce and add further costs which reflect the additional costs of operating a mine, primarily sustaining capital expenditures, sustaining leases, general & administrative costs, minesite exploration and evaluation costs, and reclamation cost accretion and amortization. Barrick believes that the use of “total cash costs” per ounce and “all-in sustaining costs” per ounce will assist investors, analysts and other stakeholders in understanding the costs associated with producing gold, understanding the economics of gold mining, assessing our operating performance and also our ability to generate free cash flow from current operations and to generate free cash flow on an overall Company basis. “Total cash costs” per ounce and “All-in sustaining costs” per ounce are intended to provide additional information only and do not have any standardized meaning under IFRS. Although a standardized definition of all-in sustaining costs was published in 2013 by the World Gold Council (a market development organization for the gold industry comprised of and funded by 26 gold mining companies from around the world, including Barrick), it is not a regulatory organization, and other companies may calculate this measure differently. Starting from the first quarter of 2019, we have renamed "cash costs" to "total cash costs" when referring to our gold operations. The calculation of total cash costs is identical to our previous calculation of cash costs with only a change in the naming convention of this non-GAAP measure. These measures should not be considered in isolation or as a substitute for measures prepared in accordance with IFRS. Further details on these non-GAAP measures are provided in the MD&A accompanying Barrick’s financial statements filed from time to time on SEDAR at www.sedar.com and on EDGAR at www.sec.gov.
Reconciliation of Gold Cost of Sales to Total cash costs, All-in sustaining costs and All-in costs, including on a per ounce basis
|
($ millions, except per ounce information in dollars)
|
|
For the three months ended
|
For the six months ended
|
|
|
Footnote
|
6/30/19
|
3/31/19
|
6/30/18
|
6/30/19
|
6/30/18
|
|
Cost of sales applicable to gold production
|
|
1,437
|
|
1,350
|
|
1,058
|
|
2,787
|
|
2,104
|
|
|
Depreciation
|
|
(431
|
)
|
(384
|
)
|
(290
|
)
|
(815
|
)
|
(588
|
)
|
|
Cash cost of sales applicable to equity method investments
|
|
62
|
|
62
|
|
0
|
|
124
|
|
0
|
|
|
By-product credits
|
|
(23
|
)
|
(24
|
)
|
(38
|
)
|
(47
|
)
|
(74
|
)
|
|
Realized (gains) losses on hedge and non-hedge derivatives
|
a
|
(1
|
)
|
0
|
|
0
|
|
(1
|
)
|
0
|
|
|
Non-recurring items
|
b
|
(9
|
)
|
(20
|
)
|
(3
|
)
|
(29
|
)
|
(10
|
)
|
|
Other
|
c
|
(26
|
)
|
(20
|
)
|
(21
|
)
|
(46
|
)
|
(42
|
)
|
|
Non-controlling interests
|
d
|
(112
|
)
|
(101
|
)
|
(78
|
)
|
(213
|
)
|
(150
|
)
|
|
Total cash costs
|
|
897
|
|
863
|
|
628
|
|
1,760
|
|
1,240
|
|
|
General & administrative costs
|
|
59
|
|
54
|
|
93
|
|
113
|
|
141
|
|
|
Minesite exploration and evaluation costs
|
e
|
12
|
|
11
|
|
14
|
|
23
|
|
20
|
|
|
Minesite sustaining capital expenditures
|
f
|
267
|
|
253
|
|
235
|
|
520
|
|
466
|
|
|
Sustaining leases
|
|
8
|
|
10
|
|
0
|
|
18
|
|
0
|
|
|
Rehabilitation - accretion and amortization (operating sites)
|
g
|
16
|
|
14
|
|
19
|
|
30
|
|
38
|
|
|
Non-controlling interest, copper operations and other
|
h
|
(76
|
)
|
(75
|
)
|
(100
|
)
|
(151
|
)
|
(155
|
)
|
|
All-in sustaining costs
|
|
1,183
|
|
1,130
|
|
889
|
|
2,313
|
|
1,750
|
|
|
Project exploration and evaluation and project costs
|
e
|
86
|
|
63
|
|
83
|
|
149
|
|
150
|
|
|
Community relations costs not related to current operations
|
|
0
|
|
1
|
|
0
|
|
1
|
|
1
|
|
|
Project capital expenditures
|
f
|
108
|
|
120
|
|
106
|
|
228
|
|
206
|
|
|
Rehabilitation - accretion and amortization (non-operating sites)
|
g
|
7
|
|
7
|
|
8
|
|
14
|
|
16
|
|
|
Non-controlling interest and copper operations and other
|
h
|
(28
|
)
|
(3
|
)
|
(3
|
)
|
(31
|
)
|
(8
|
)
|
|
All-in costs
|
|
1,356
|
|
1,318
|
|
1,083
|
|
2,674
|
|
2,115
|
|
|
Ounces sold - equity basis (000s ounces)
|
i
|
1,372
|
|
1,365
|
|
1,037
|
|
2,737
|
|
2,108
|
|
|
Cost of sales per ounce
|
j,k
|
964
|
|
947
|
|
882
|
|
956
|
|
865
|
|
|
Total cash costs per ounce
|
k
|
651
|
|
631
|
|
605
|
|
641
|
|
589
|
|
|
Total cash costs per ounce (on a co-product basis)
|
k,l
|
663
|
|
644
|
|
630
|
|
654
|
|
613
|
|
|
All-in sustaining costs per ounce
|
k
|
869
|
|
825
|
|
856
|
|
842
|
|
830
|
|
|
All-in sustaining costs per ounce (on a co-product basis)
|
k,l
|
881
|
|
838
|
|
881
|
|
855
|
|
854
|
|
|
All-in costs per ounce
|
k
|
999
|
|
964
|
|
1,043
|
|
976
|
|
1,003
|
|
|
All-in costs per ounce (on a co-product basis)
|
k,l
|
1,011
|
|
977
|
|
1,068
|
|
989
|
|
1,027
|
|
a.
Realized (gains) losses on hedge and non-hedge derivatives
Includes realized hedge losses of $nil and $nil, respectively, for the three and six month periods ended June 30, 2019 (March 31, 2019: $nil and June 30, 2018: $1 million and $2 million), and realized non-hedge gains of $1 million and $1 million, respectively, for the three and six month periods ended June 30, 2019 (March 31, 2019: $nil and June 30, 2018: $1 million and $2 million, respectively). Refer to note 5 to the Financial Statements for further information.
b.
Non-recurring items
Non-recurring items in 2019 relate to organizational restructuring. These costs are not indicative of our cost of production and have been excluded from the calculation of total cash costs.
c.
Other
Other adjustments for the three and six month periods ended June 30, 2019 include the removal of total cash costs and by-product credits associated with our Pierina mine, which is mining incidental ounces as it enters closure, of $19 million and $37 million, respectively (March 31, 2019: $18 million and June 30, 2018: $22 million and $43 million, respectively).
d.
Non-controlling interests
Non-controlling interests include non-controlling interests related to gold production of $171 million and $323 million, respectively, for the three and six month periods ended June 30, 2019 (March 31, 2019: $152 million and June 30, 2018: $112 million and $218 million, respectively). Non-controlling interests include Pueblo Viejo and Acacia. Starting January 1, 2019, the effective date of the Merger, non-controlling interests also include Loulo-Gounkoto and Tongon. Refer to note 5 to the Financial Statements for further information.
e.
Exploration and evaluation costs
Exploration, evaluation and project expenses are presented as minesite sustaining if it supports current mine operations and project if it relates to future projects. Refer to page 71 of this MD&A.
f.
Capital expenditures
Capital expenditures are related to our gold sites only and are presented on a 100% cash basis starting from January 1, 2019 and on a 100% accrued basis for the three and six month periods ended June 30, 2018. They are split between minesite sustaining and project capital expenditures. Project capital expenditures are distinct projects designed to increase the net present value of the mine and are not related to current production. Significant projects in the current year are stripping at Cortez Crossroads, the Goldrush exploration declines, the Deep South Expansion, and construction of the third shaft at Turquoise Ridge. Refer to page 70 of this MD&A.
g.
Rehabilitation—accretion and amortization
Includes depreciation on the assets related to rehabilitation provisions of our gold operations and accretion on the rehabilitation provision of our gold operations, split between operating and non-operating sites.
h.
Non-controlling interest and copper operations
Removes general & administrative costs related to non-controlling interests and copper based on a percentage allocation of revenue. Also removes exploration, evaluation and project expenses, rehabilitation costs and capital expenditures incurred by our copper sites and the non-controlling interest of our Acacia and Pueblo Viejo operating segments and South Arturo. Also removes the non-controlling interest of our Loulo-Gounkoto and Tongon operating segments commencing January 1, 2019, the effective date of the Merger, and includes capital expenditures applicable to equity method investments. Figures remove the impact of Pierina. The impact is summarized as the following:
|
($ millions)
|
For the three months ended
|
For the six months ended
|
|
Non-controlling interest, copper operations and other
|
6/30/19
|
3/31/19
|
6/30/18
|
6/30/19
|
6/30/18
|
|
General & administrative costs
|
(23
|
)
|
(10
|
)
|
(41
|
)
|
(33
|
)
|
(48
|
)
|
|
Minesite exploration and evaluation expenses
|
0
|
|
(1
|
)
|
(1
|
)
|
(1
|
)
|
(1
|
)
|
|
Rehabilitation - accretion and amortization (operating sites)
|
(1
|
)
|
(1
|
)
|
(2
|
)
|
(2
|
)
|
(3
|
)
|
|
Minesite sustaining capital expenditures
|
(52
|
)
|
(63
|
)
|
(56
|
)
|
(115
|
)
|
(103
|
)
|
|
All-in sustaining costs total
|
(76
|
)
|
(75
|
)
|
(100
|
)
|
(151
|
)
|
(155
|
)
|
|
Project exploration and evaluation and project costs
|
(26
|
)
|
(2
|
)
|
(3
|
)
|
(28
|
)
|
(6
|
)
|
|
Project capital expenditures
|
(2
|
)
|
(1
|
)
|
0
|
|
(3
|
)
|
(2
|
)
|
|
All-in costs total
|
(28
|
)
|
(3
|
)
|
(3
|
)
|
(31
|
)
|
(8
|
)
|
i.
Ounces sold - equity basis
Figures remove the impact of Pierina which is mining incidental ounces as it enters closure.
j.
Cost of sales per ounce
Figures remove the cost of sales impact of Pierina of $44 million and $71 million, respectively, for the three and six month periods ended June 30, 2019 (March 31, 2019: $27 million and June 30, 2018: $30 million and $62 million, respectively),which is mining incidental ounces as it enters closure. Cost of sales per ounce excludes non-controlling interest related to gold production. Cost of sales applicable to gold per ounce is calculated using cost of sales on an attributable basis (removing the non-controlling interest of 40% Pueblo Viejo, 36.1% Acacia and 40% South Arturo from cost of sales), divided by attributable gold ounces. The non-controlling interest of 20% Loulo-Gounkoto and 10.3% of Tongon is also removed from cost of sales and our proportionate share of cost of sales attributable to equity method investments (Kibali and Morila) is included commencing January 1, 2019, the effective date of the Merger.
k.
Per ounce figures
Cost of sales per ounce, total cash costs per ounce, all-in sustaining costs per ounce and all-in costs per ounce may not calculate based on amounts presented in this table due to rounding.
l.
Co-product costs per ounce
Total cash costs per ounce, all-in sustaining costs per ounce and all-in costs per ounce presented on a co-product basis removes the impact of by-product credits of our gold production (net of non-controlling interest) calculated as:
| ($ millions)
|
|
For the three months ended
|
For the six months ended
|
|
6/30/19
|
3/31/19
|
6/30/19
|
6/30/19
|
6/30/18
|
|
By-product credits
|
23
|
24
|
38
|
47
|
74
|
|
Non-controlling interest
|
(7)
|
(8)
|
(13)
|
(15)
|
(24)
|
| By-product credits (net of non-controlling interest)
|
16
|
16
|
(25)
|
32
|
50
|
Endnote 8
“C1 cash costs” per pound and “All-in sustaining costs” per pound are non-GAAP financial performance measures. “C1 cash costs” per pound is based on cost of sales but excludes the impact of depreciation and royalties and includes treatment and refinement charges. “All-in sustaining costs” per pound begins with “C1 cash costs” per pound and adds further costs which reflect the additional costs of operating a mine, primarily sustaining capital expenditures, general & administrative costs and royalties and production taxes. Barrick believes that the use of “C1 cash costs” per pound and “all-in sustaining costs” per pound will assist investors, analysts, and other stakeholders in understanding the costs associated with producing copper, understanding the economics of copper mining, assessing our operating performance, and also our ability to generate free cash flow from current operations and to generate free cash flow on an overall Company basis. “C1 cash costs” per pound and “All-in sustaining costs” per pound are intended to provide additional information only, do not have any standardized meaning under IFRS, and may not be comparable to similar measures of performance presented by other companies. These measures should not be considered in isolation or as a substitute for measures of performance prepared in accordance with IFRS. Further details on these non-GAAP measures are provided in the MD&A accompanying Barrick’s financial statements filed from time to time on SEDAR at www.sedar.com and on EDGAR at www.sec.gov.
Reconciliation of Copper Cost of Sales to C1 cash costs and All-in sustaining costs, including on a per pound basis
|
($ millions, except per pound information in dollars)
|
For the three months ended
|
For the six months ended
|
|
|
6/30/19
|
3/31/19
|
6/30/18
|
6/30/19
|
6/30/18
|
|
Cost of sales
|
101
|
|
131
|
|
108
|
|
232
|
|
204
|
|
|
Depreciation/amortization
|
(28
|
)
|
(42
|
)
|
(30
|
)
|
(70
|
)
|
(49
|
)
|
|
Treatment and refinement charges
|
25
|
|
31
|
|
29
|
|
56
|
|
60
|
|
|
Cash cost of sales applicable to equity method investments
|
69
|
|
66
|
|
59
|
|
135
|
|
122
|
|
|
Less: royalties and production taxes
a
|
(9
|
)
|
(12
|
)
|
(9
|
)
|
(21
|
)
|
(19
|
)
|
|
By-product credits
|
(2
|
)
|
(3
|
)
|
(1
|
)
|
(5
|
)
|
(3
|
)
|
|
Other
|
(5
|
)
|
0
|
0
|
|
(5
|
)
|
0
|
|
|
C1 cash cost of sales
|
151
|
|
171
|
|
156
|
|
322
|
|
315
|
|
|
General & administrative costs
|
6
|
|
5
|
|
11
|
|
11
|
|
16
|
|
|
Rehabilitation - accretion and amortization
|
3
|
|
3
|
|
3
|
|
6
|
|
8
|
|
|
Royalties and production taxes
a
|
9
|
|
12
|
|
9
|
|
21
|
|
19
|
|
|
Minesite exploration and evaluation costs
|
1
|
|
2
|
|
1
|
|
3
|
|
1
|
|
|
Minesite sustaining capital expenditures
|
48
|
|
59
|
|
46
|
|
107
|
|
88
|
|
|
Sustaining leases
|
1
|
|
1
|
|
0
|
|
2
|
|
0
|
|
|
Inventory write-downs
|
0
|
|
0
|
|
0
|
|
0
|
|
0
|
|
|
All-in sustaining costs
|
219
|
|
253
|
|
226
|
|
472
|
|
447
|
|
|
Pounds sold - consolidated basis (millions pounds)
|
96
|
|
103
|
|
74
|
|
199
|
|
159
|
|
|
Cost of sales per pound
b,c
|
2.04
|
|
2.21
|
|
2.45
|
|
2.13
|
|
2.25
|
|
|
C1 cash cost per pound
b
|
1.59
|
|
1.66
|
|
2.10
|
|
1.62
|
|
1.98
|
|
|
All-in sustaining costs per pound
b
|
2.28
|
|
2.46
|
|
3.04
|
|
2.37
|
|
2.81
|
|
-
For the three and six month periods ended June 30, 2019, royalties and production taxes include royalties of $9 million and $21 million, respectively (March 31, 2019: $12 million and June 30, 2018: $8 million and $17 million, respectively).
-
Cost of sales per pound, C1 cash costs per pound and all-in sustaining costs per pound may not calculate based on amounts presented in this table due to rounding.
-
Cost of sales applicable to copper per pound is calculated using cost of sales including our proportionate share of cost of sales attributable to equity method investments (Zaldívar and Jabal Sayid), divided by consolidated copper pounds (including our proportionate share of copper pounds from our equity method investments).
Endnote 9
A Tier One Gold Asset is a mine with a stated life in excess of 10 years with 2017 production of at least 500,000 ounces of gold and 2017 total cash cost per ounce within the bottom half of Wood Mackenzie’s cost curve tools (excluding state-owned and privately-owned mines). For purposes of determining Tier One Gold Assets, total cash cost per ounce is based on data from Wood Mackenzie as of August 31, 2018, except in respect of Barrick’s mines where Barrick may rely on its internal data which is more current and reliable. The Wood Mackenzie calculation of total cash cost per ounce may not be identical to the manner in which Barrick calculates comparable measures. Total cash cost per ounce is a non-GAAP financial performance measure with no standardized meaning under IFRS and therefore may not be comparable to similar measures presented by other issuers. Total cash cost per ounce should not be considered by investors as an alternative to operating profit, net profit attributable to shareholders, or to other IFRS measures. Barrick believes that total cash cost per ounce is a useful indicator for investors and management of a mining company’s performance as it provides an indication of a company’s profitability and efficiency, the trends in cash costs as the company’s operations mature, and a benchmark of performance to allow for comparison against other companies. Wood Mackenzie is an independent third party research and consultancy firm that provides data for, among others, the metals and mining industry. Wood Mackenzie does not have any affiliation to Barrick.
Endnote 10
The pro forma reserves and resources figures of Nevada Gold Mines were derived by adding the respective reserves and resources in respect of Nevada operations reported by Barrick in its Q4 2018 Report and Newmont in its press release dated February 21, 2019 reporting its 2018 Reserves and Resources and its annual report on Form 10-K for the fiscal year ended December 31, 2018 in respect of the relevant Nevada properties set out in endnotes 3 and 4. The pro forma reserves and resources are provided for illustrative purposes only. Barrick and Newmont calculate such figures based on different standards and assumptions, and accordingly such figures may not be directly comparable and the pro forma reserves and resources may be subject to adjustments due to such differing standards and assumptions. In particular, Barrick mineral reserves and resources have been prepared according to Canadian Institute of Mining, Metallurgy and Petroleum 2014 Definition Standards for Mineral Resources and Mineral Reserves as incorporated by National Instrument 43-101 – Standards of Disclosure for Mineral Projects, which differ from the requirements of U.S. securities laws. Newmont’s reported reserves are prepared in compliance with Industry Guide 7 published by the SEC, however, the SEC does not recognize the terms “resources” and “measured and indicted resources”. Newmont has determined that its reported “resources” would be substantively the same as those prepared using Guidelines established by the Society of Mining, Metallurgy and Exploration (SME) and that its reported measured and indicated resources (combined) are equivalent to “Mineralized Material” disclosed in its annual report on Form 10-K.
Endnote 11
Reserves and resources of Barrick in Nevada are stated on an attributable basis as of December 31, 2018 and include Goldstrike, Cortez, Goldrush, South Arturo (60%) and Turquoise Ridge (75%). Proven reserves of 84.4 million tonnes grading 4.36g/t, representing 11.8 million ounces of gold. Probable reserves of 155.6 million tonnes grading 2.93g/t, representing 14.7 million ounces of gold. Measured resources of 13.5 million tonnes grading 4.22g/t, representing 1.8 million ounces of gold. Indicated resources of 101.6 million tonnes grading 4.34g/t, representing 14.2 million ounces of gold. Inferred resources of 28.7 million tonnes grading 5.2g/t, representing 4.8 million ounces of gold. Complete mineral reserve and resource data for all Barrick mines and projects referenced in this press release, including tonnes, grades, and ounces, as well as the assumptions on which the mineral reserves for Barrick are reported, are set out in Barrick’s Q4 2018 Report issued on February 13, 2019.
Endnote 12
Reserves and resources of Newmont in Nevada are stated on an attributable basis as of December 31, 2018 and include Carlin, Phoenix, Lone Tree, Twin Creeks (including Newmont’s 25% equity in Turquoise Ridge) and Long Canyon. Proven reserves of 46.6 million tonnes grading 3.84g/t, representing 5.8 million ounces of gold. Probable reserves of 378.1 million tonnes grading 1.32g/t, representing 16.0 million ounces of gold. Measured resources of 19.7 million tonnes grading 2.2 g/t, representing 1.4 million ounces of gold. Indicated resources of 244.4 million tonnes grading 1.27g/t, representing 10.0 million ounces of gold. Inferred resources of 45.5 million tonnes grading 1.81g/t, representing 2.7 million ounces of gold. Complete mineral reserve and resource data for all Newmont mines and projects referenced in this press release, including tonnes, grades, and ounces, as well as the assumptions on which the mineral reserves for Newmont are reported, are set out in Newmont’s press release dated February 21, 2019 reporting its 2018 Reserves and Resources and its annual report on Form 10-K for the fiscal year ended December 31, 2018.
Endnote 13
See the Technical Report on the Pueblo Viejo mine, Sanchez Ramirez Province, Dominican Republic,dated March 19, 2018, and filed on SEDAR at www.sedar.com and EDGAR at www.sec.gov on March 23, 2018.
Endnote 14
Estimated in accordance with National Instrument 43-101 as at December 31, 2018. For additional information refer to Section 24.2, “Alternate Case – Ore Reserves and Economics at $1,200/oz Gold Price” of the Technical Report for the Massawa gold project dated as of July 23, 2019, and filed on SEDAR at www.sedar.com on July 23, 2019 and EDGAR at www.sec.gov on July 25, 2019.
Endnote 15
Estimated in accordance with National Instrument 43-101 as at December 31, 2018, complete mineral resource data can be found on page 44-45 of Barrick’s 2018 Form 40-F/Annual Information Form on file with the SEC at www.sec.gov and Canadian provincial securities regulatory authorities at www.sedar.com.
Endnote 16
On a 100% basis.
Endnote 17
These five operations are part of Nevada Gold Mines from July 1, 2019. Amounts include Cortez (100%), Goldstrike (100%) and Turquoise Ridge (75%), also known as Barrick Nevada, from January 1, 2019 to June 30, 2019, and Cortez, Carlin (which includes Goldstrike), Turquoise Ridge/Twin Creeks, Phoenix and Long Canyon on a 61.5% basis from July 1, 2019 onwards as a result of the formation of Nevada Gold Mines with Newmont Goldcorp on July 1, 2019.
Endnote 18
Includes our 60% share of South Arturo from January 1, 2019 to June 30, 2019 and 36.9% from July 1, 2019 onwards as a result of the formation of Nevada Gold Mines with Newmont Goldcorp on July 1, 2019.
Endnote 19
Other sites include Lagunas Norte, Golden Sunlight, and Morila (40%) and excludes Pierina which is mining incidental ounces as it enters closure. Due to the planned ramp down of operations, we will cease to include production or non-GAAP cost metrics for Golden Sunlight or Morila after the second quarter and Lagunas Norte after the end of the third quarter.
Endnote 20
Total cash costs and all-in sustaining costs per ounce include the impact of hedges and/or costs allocated to non-operating sites.
Endnote 21
Operating unit guidance ranges reflect expectations at each individual operating unit, and may not add up to the company-wide guidance range total. Guidance ranges exclude Pierina which is mining incidental ounces as it enters closure.
Endnote 22
Includes corporate administration costs.
Endnote 23
Reflects impact on the remaining six months of 2019.
Endnote 24
Due to our hedging activities, which are reflected in these sensitivities, we are partially protected against changes in these factors.
Financial and Operating Highlights
|
|
For the three months ended
|
For the six months ended
|
|
|
6/30/19
|
3/31/19
|
% Change
|
6/30/18
|
% Change
|
6/30/19
|
6/30/18
|
% Change
|
|
Financial Results
($ millions)
|
|
|
|
|
|
|
|
|
|
Revenues
|
2,063
|
|
2,093
|
|
(1
|
)%
|
1,712
|
|
21
|
%
|
4,156
|
|
3,502
|
|
19
|
%
|
|
Cost of sales
|
1,545
|
|
1,490
|
|
4
|
%
|
1,176
|
|
31
|
%
|
3,035
|
|
2,328
|
|
30
|
%
|
|
Net earnings (loss)
a
|
194
|
|
111
|
|
75
|
%
|
(94
|
)
|
306
|
%
|
305
|
|
64
|
|
377
|
%
|
|
Adjusted net earnings
b
|
154
|
|
184
|
|
(16
|
)%
|
81
|
|
90
|
%
|
338
|
|
251
|
|
35
|
%
|
|
Adjusted EBITDA
b
|
972
|
|
1,002
|
(3
|
)%
|
679
|
43
|
%
|
1,974
|
|
1,499
|
|
32
|
%
|
|
Total capital expenditures - sustaining
c
|
267
|
|
253
|
|
6
|
%
|
212
|
|
26
|
%
|
520
|
|
445
|
|
17
|
%
|
|
Total project capital expenditures
c
|
108
|
|
120
|
|
(10
|
)%
|
101
|
|
7
|
%
|
228
|
|
194
|
|
18
|
%
|
|
Total consolidated capital expenditures
c,d
|
379
|
|
374
|
|
1
|
%
|
313
|
|
21
|
%
|
753
|
|
639
|
|
18
|
%
|
|
Net cash provided by operating activities
|
434
|
|
520
|
|
(17
|
)%
|
141
|
|
208
|
%
|
954
|
|
648
|
|
47
|
%
|
|
Free cash flow
b
|
55
|
|
146
|
|
(62
|
)%
|
(172
|
)
|
132
|
%
|
201
|
|
9
|
|
2,133
|
%
|
|
Per share data (dollars)
|
|
|
|
|
|
|
|
|
|
Net earnings (loss) (basic and diluted)
|
0.11
|
|
0.06
|
|
83
|
%
|
(0.08
|
)
|
238
|
%
|
0.17
|
|
0.05
|
|
240
|
%
|
|
Adjusted net earnings (basic)
b
|
0.09
|
|
0.11
|
|
(18
|
)%
|
0.07
|
|
29
|
%
|
0.19
|
|
0.22
|
|
(14
|
)%
|
|
Weighted average diluted common shares (millions of shares)
|
1,752
|
|
1,746
|
|
0
|
%
|
1,167
|
|
50
|
%
|
1,749
|
|
1,167
|
|
50
|
%
|
|
Operating Results
|
|
|
|
|
|
|
|
|
|
Gold production (thousands of ounces)
e
|
1,353
|
|
1,367
|
|
(1
|
)%
|
1,067
|
|
27
|
%
|
2,720
|
|
2,116
|
|
29
|
%
|
|
Gold sold (thousands of ounces)
e
|
1,372
|
|
1,365
|
|
1
|
%
|
1,037
|
|
32
|
%
|
2,737
|
|
2,108
|
|
30
|
%
|
|
Per ounce data
|
|
|
|
|
|
|
|
|
|
Market gold price ($/oz)
|
1,309
|
|
1,304
|
|
0
|
%
|
1,306
|
|
0
|
%
|
1,307
|
|
1,318
|
|
(1
|
)%
|
|
Realized gold price
b,e
($/oz)
|
1,317
|
|
1,307
|
|
1
|
%
|
1,313
|
|
0
|
%
|
1,312
|
|
1,323
|
|
(1
|
)%
|
|
Cost of sales (Barrick’s share)
e,f
($/oz)
|
964
|
|
947
|
|
2
|
%
|
882
|
|
9
|
%
|
956
|
|
865
|
|
11
|
%
|
|
Total cash costs
b,e
($/oz)
|
651
|
|
631
|
|
3
|
%
|
605
|
|
8
|
%
|
641
|
|
589
|
|
9
|
%
|
|
All-in sustaining costs
b,e
($/oz)
|
869
|
|
825
|
|
5
|
%
|
856
|
|
2
|
%
|
842
|
|
830
|
|
1
|
%
|
|
Copper production (millions of pounds)
g
|
97
|
|
106
|
|
(8
|
)%
|
83
|
|
17
|
%
|
203
|
|
168
|
|
21
|
%
|
|
Copper sold (millions of pounds)
g
|
96
|
|
103
|
|
(7
|
)%
|
74
|
|
30
|
%
|
199
|
|
159
|
|
25
|
%
|
|
Per pound data
|
|
|
|
|
|
|
|
|
|
Market copper price ($/lb)
|
2.77
|
|
2.82
|
|
(2
|
)%
|
3.12
|
|
(11
|
)%
|
2.80
|
|
3.14
|
|
(11
|
)%
|
|
Realized copper price
b,g
($/lb)
|
2.62
|
|
3.07
|
|
(15
|
)%
|
3.11
|
|
(16
|
)%
|
2.85
|
|
3.04
|
|
(6
|
)%
|
|
Cost of sales (Barrick’s share)
g,h
($/lb)
|
2.04
|
|
2.21
|
|
(8
|
)%
|
2.45
|
|
(17
|
)%
|
2.13
|
|
2.25
|
|
(5
|
)%
|
|
C1 cash costs
b,g
($/lb)
|
1.59
|
|
1.66
|
|
(4
|
)%
|
2.10
|
|
(24
|
)%
|
1.62
|
|
1.98
|
|
(18
|
)%
|
|
All-in sustaining costs
b,g
($/lb)
|
2.28
|
|
2.46
|
|
(7
|
)%
|
3.04
|
|
(25
|
)%
|
2.37
|
|
2.81
|
|
(16
|
)%
|
|
|
As at 6/30/19
|
As at 3/31/19
|
% Change
|
As at 6/30/18
|
% Change
|
|
|
|
|
Financial Position
($ millions)
|
|
|
|
|
|
|
|
|
|
Debt (current and long-term)
|
5,807
|
|
5,807
|
|
0
|
%
|
6,392
|
|
(9
|
)%
|
|
|
|
|
Cash and equivalents
|
2,153
|
|
2,153
|
|
0
|
%
|
2,085
|
|
3
|
%
|
|
|
|
|
Debt, net of cash
|
3,654
|
|
3,654
|
|
0
|
%
|
4,307
|
|
(15
|
)%
|
|
|
|
-
Net earnings (loss) represents net earnings (loss) attributable to the equity holders of the Company.
-
Adjusted net earnings, adjusted EBITDA, free cash flow, adjusted net earnings per share, realized gold price, all-in sustaining costs, total cash costs, C1 cash costs and realized copper price are non-GAAP financial performance measures with no standardized meaning under IFRS and therefore may not be comparable to similar measures presented by other issuers. For further information and a detailed reconciliation of each non-GAAP measure to the most directly comparable IFRS measure, please see pages 78 to 99 of our second quarter MD&A.
-
Amounts presented on a consolidated cash basis. Project capital expenditures are included in our calculation of all-in costs, but not included in our calculation of all-in sustaining costs.
-
Total consolidated capital expenditures also includes capitalized interest.
-
Includes Acacia on a 63.9% basis, Pueblo Viejo on a 60% basis, South Arturo on a 60% basis, and Veladero on a 50% basis, which reflects our equity share of production and sales.Also includes Loulo-Gounkoto on an 80% basis, Kibali on a 45% basis, Tongon on an 89.7% basis and Morila on a 40% basis, which reflects our equity share of production and sales, commencing January 1, 2019, the effective date of the merger with Randgold.
-
Cost of sales per ounce (Barrick’s share) is calculated as cost of sales - gold on an attributable basis (excluding Pierina) divided by gold ounces sold.
-
Amounts reflect production and sales from Jabal Sayid and Zaldívar on a 50% basis, which reflects our equity share of production, and Lumwana.
-
Cost of sales per pound (Barrick’s share) is calculated as cost of sales - copper plus our equity share of cost of sales attributable to Zaldívar and Jabal Sayid divided by copper pounds sold.
Consolidated Statements of Income
|
Barrick Gold Corporation
(in millions of United States dollars, except per share data) (Unaudited)
|
Three months ended June 30,
|
Six months ended June 30,
|
|
|
2019
|
2018
|
2019
|
2018
|
|
Revenue (notes 5 and 6)
|
$2,063
|
|
$1,712
|
|
$4,156
|
|
$3,502
|
|
|
Costs and expenses (income)
|
|
|
|
|
|
Cost of sales (notes 5 and 7)
|
1,545
|
|
1,176
|
|
3,035
|
|
2,328
|
|
|
General and administrative expenses
|
59
|
|
93
|
|
113
|
|
141
|
|
|
Exploration, evaluation and project expenses
|
98
|
|
97
|
|
172
|
|
170
|
|
|
Impairment charges (notes 9B and 13)
|
12
|
|
59
|
|
15
|
|
61
|
|
|
(Gain) loss on currency translation
|
(6
|
)
|
75
|
|
16
|
|
90
|
|
|
Closed mine rehabilitation
|
16
|
|
9
|
|
41
|
|
—
|
|
|
Income from equity investees (note 12)
|
(50
|
)
|
(10
|
)
|
(78
|
)
|
(26
|
)
|
|
Gain on non-hedge derivatives
|
—
|
|
(1
|
)
|
(1
|
)
|
(3
|
)
|
|
Other expense (note 9A)
|
7
|
|
38
|
|
34
|
|
39
|
|
|
Income before finance costs and income taxes
|
$382
|
|
$176
|
|
$809
|
|
$702
|
|
|
Finance costs, net
|
(118
|
)
|
(136
|
)
|
(238
|
)
|
(269
|
)
|
|
Income before income taxes
|
$264
|
|
$40
|
|
$571
|
|
$433
|
|
|
Income tax expense (note 10)
|
(41
|
)
|
(116
|
)
|
(208
|
)
|
(317
|
)
|
|
Net income (loss)
|
$223
|
|
($76
|
)
|
$363
|
|
$116
|
|
|
Attributable to:
|
|
|
|
|
|
Equity holders of Barrick Gold Corporation
|
$194
|
|
($94
|
)
|
$305
|
|
$64
|
|
|
Non-controlling interests
|
$29
|
|
$18
|
|
$58
|
|
$52
|
|
|
Earnings (loss) per share data attributable to the equity holders of Barrick Gold Corporation (note 8)
|
|
|
|
|
|
Net income (loss)
|
|
|
|
|
|
Basic
|
$0.11
|
|
($0.08
|
)
|
$0.17
|
|
$0.05
|
|
|
Diluted
|
$0.11
|
|
($0.08
|
)
|
$0.17
|
|
$0.05
|
|
The notes to these unaudited condensed interim financial statements, which are contained in the Second Quarter Report 2019 available on our website are an integral part of these consolidated financial statements.
Consolidated Statements of Comprehensive Income
|
Barrick Gold Corporation
(in millions of United States dollars) (Unaudited)
|
Three months ended June 30,
|
Six months ended June 30,
|
|
|
2019
|
2018
|
2019
|
2018
|
|
Net income (loss)
|
$223
|
|
($76
|
)
|
$363
|
|
$116
|
|
|
Other comprehensive (loss) income, net of taxes
|
|
|
|
|
|
Items that may be reclassified subsequently to profit or loss:
|
|
|
|
|
|
Unrealized gains (losses) on derivatives designated as cash flow hedges, net of tax $nil, ($3), $nil and ($6)
|
—
|
|
4
|
|
—
|
|
10
|
|
|
Currency translation adjustments, net of tax $nil, $nil, $nil and $nil
|
(1
|
)
|
2
|
|
(3
|
)
|
2
|
|
|
Items that will not be reclassified to profit or loss:
|
|
|
|
|
|
Actuarial gain (loss) on post employment benefit obligations, net of tax $nil, $nil, $nil and $nil
|
—
|
|
1
|
|
—
|
|
1
|
|
|
Net unrealized change on equity investments, net of tax $nil, $nil, $nil and $nil
|
11
|
|
(4
|
)
|
8
|
|
(8
|
)
|
|
Net realized change on equity investments, net of tax $nil, $nil, $nil and $nil
|
—
|
|
—
|
|
(1
|
)
|
—
|
|
|
Total other comprehensive income
|
10
|
|
3
|
|
4
|
|
5
|
|
|
Total comprehensive income (loss)
|
$233
|
|
($73
|
)
|
$367
|
|
$121
|
|
|
Attributable to:
|
|
|
|
|
|
Equity holders of Barrick Gold Corporation
|
$204
|
|
($91
|
)
|
$309
|
|
$69
|
|
|
Non-controlling interests
|
$29
|
|
$18
|
|
$58
|
|
$52
|
|
The notes to these unaudited condensed interim financial statements, which are contained in the Second Quarter Report 2019 available on our website are an integral part of these consolidated financial statements.
Consolidated Statements of Cash Flow
|
Barrick Gold Corporation
(in millions of United States dollars) (Unaudited)
|
Three months ended June 30,
|
Six months ended June 30,
|
|
|
2019
|
2018
|
2019
|
2018
|
|
OPERATING ACTIVITIES
|
|
|
|
|
|
Net income (loss)
|
$223
|
|
($76
|
)
|
$363
|
|
$116
|
|
|
Adjustments for the following items:
|
|
|
|
|
|
Depreciation
|
466
|
|
328
|
|
901
|
|
653
|
|
|
Finance costs
|
125
|
|
139
|
|
252
|
|
277
|
|
|
Impairment charges (notes 9B and 13)
|
12
|
|
59
|
|
15
|
|
61
|
|
|
Income tax expense (note 10)
|
41
|
|
116
|
|
208
|
|
317
|
|
|
Gain on sale of non-current assets
|
(12
|
)
|
(2
|
)
|
(12
|
)
|
(48
|
)
|
|
(Gain) loss on currency translation
|
(6
|
)
|
75
|
|
16
|
|
90
|
|
|
Change in working capital (note 11)
|
(86
|
)
|
(81
|
)
|
(330
|
)
|
(233
|
)
|
|
Other operating activities (note 11)
|
42
|
|
(56
|
)
|
14
|
|
(144
|
)
|
|
Operating cash flows before interest and income taxes
|
805
|
|
502
|
|
1,427
|
|
1,089
|
|
|
Interest paid
|
(137
|
)
|
(155
|
)
|
(165
|
)
|
(183
|
)
|
|
Income taxes paid
|
(234
|
)
|
(206
|
)
|
(308
|
)
|
(258
|
)
|
|
Net cash provided by operating activities
|
434
|
|
141
|
|
954
|
|
648
|
|
|
INVESTING ACTIVITIES
|
|
|
|
|
|
Property, plant and equipment
|
|
|
|
|
|
Capital expenditures (note 5)
|
(379
|
)
|
(313
|
)
|
(753
|
)
|
(639
|
)
|
|
Sales proceeds
|
15
|
|
5
|
|
18
|
|
52
|
|
|
Investment purchases
|
(4
|
)
|
(38
|
)
|
(7
|
)
|
(39
|
)
|
|
Cash acquired in merger
|
—
|
|
—
|
|
751
|
|
—
|
|
|
Other investing activities (note 11)
|
17
|
|
(1
|
)
|
62
|
|
(5
|
)
|
|
Net cash provided by (used in) investing activities
|
(351
|
)
|
(347
|
)
|
71
|
|
(631
|
)
|
|
FINANCING ACTIVITIES
|
|
|
|
|
|
Lease repayments
|
(6
|
)
|
—
|
|
(18
|
)
|
—
|
|
|
Debt repayments
|
—
|
|
(8
|
)
|
(16
|
)
|
(31
|
)
|
|
Dividends
|
(61
|
)
|
(32
|
)
|
(394
|
)
|
(63
|
)
|
|
Funding from non-controlling interests
|
8
|
|
4
|
|
14
|
|
12
|
|
|
Disbursements to non-controlling interests
|
(23
|
)
|
(56
|
)
|
(28
|
)
|
(82
|
)
|
|
Net cash used in financing activities
|
(82
|
)
|
(92
|
)
|
(442
|
)
|
(164
|
)
|
|
Effect of exchange rate changes on cash and equivalents
|
(1
|
)
|
(1
|
)
|
(1
|
)
|
(2
|
)
|
|
Net increase (decrease) in cash and equivalents
|
—
|
|
(299
|
)
|
582
|
|
(149
|
)
|
|
Cash and equivalents at the beginning of period
|
2,153
|
|
2,384
|
|
1,571
|
|
2,234
|
|
|
Cash and equivalents at the end of period
|
$2,153
|
|
$2,085
|
|
$2,153
|
|
$2,085
|
|
The notes to these unaudited condensed interim financial statements, which are contained in the Second Quarter Report 2019 available on our website are an integral part of these consolidated financial statements.
Consolidated Balance Sheets
|
Barrick Gold Corporation
(in millions of United States dollars) (Unaudited)
|
As at June 30,
|
As at December 31,
|
|
|
2019
|
2018
|
|
ASSETS
|
|
|
|
Current assets
|
|
|
|
Cash and equivalents (note 14A)
|
$2,153
|
|
$1,571
|
|
|
Accounts receivable
|
427
|
|
248
|
|
|
Inventories
|
1,930
|
|
1,852
|
|
|
Other current assets
|
333
|
|
307
|
|
|
Total current assets
|
$4,843
|
|
$3,978
|
|
|
Non-current assets
|
|
|
|
Equity in investees (note 12)
|
4,459
|
|
1,234
|
|
|
Property, plant and equipment
|
16,890
|
|
12,826
|
|
|
Goodwill
|
2,837
|
|
1,176
|
|
|
Intangible assets
|
227
|
|
227
|
|
|
Deferred income tax assets
|
252
|
|
259
|
|
|
Non-current portion of inventory
|
1,830
|
|
1,696
|
|
|
Other assets
|
1,264
|
|
1,235
|
|
|
Total assets
|
$32,602
|
|
$22,631
|
|
|
LIABILITIES AND EQUITY
|
|
|
|
Current liabilities
|
|
|
|
Accounts payable
|
$1,064
|
|
$1,101
|
|
|
Debt (note 14B)
|
303
|
|
43
|
|
|
Current income tax liabilities
|
133
|
|
203
|
|
|
Other current liabilities
|
282
|
|
321
|
|
|
Total current liabilities
|
$1,782
|
|
$1,668
|
|
|
Non-current liabilities
|
|
|
|
Debt (note 14B)
|
5,504
|
|
5,695
|
|
|
Provisions
|
3,179
|
|
2,904
|
|
|
Deferred income tax liabilities
|
1,941
|
|
1,236
|
|
|
Other liabilities
|
1,729
|
|
1,743
|
|
|
Total liabilities
|
$14,135
|
|
$13,246
|
|
|
Equity
|
|
|
|
Capital stock (note 16)
|
$28,801
|
|
$20,883
|
|
|
Deficit
|
(13,227
|
)
|
(13,453
|
)
|
|
Accumulated other comprehensive loss
|
(154
|
)
|
(158
|
)
|
|
Other
|
326
|
|
321
|
|
|
Total equity attributable to Barrick Gold Corporation shareholders
|
$15,746
|
|
$7,593
|
|
|
Non-controlling interests
|
2,721
|
|
1,792
|
|
|
Total equity
|
$18,467
|
|
$9,385
|
|
|
Contingencies and commitments (notes 5 and 17)
|
|
|
|
Total liabilities and equity
|
$32,602
|
|
$22,631
|
|
The notes to these unaudited condensed interim financial statements, which are contained in the Second Quarter Report 2019 available on our website are an integral part of these consolidated financial statements.
Consolidated Statements of Changes in Equity
|
Barrick Gold Corporation
|
|
Attributable to equity holders of the company
|
|
|
|
(in millions of United States dollars) (Unaudited)
|
Common Shares (in thousands)
|
Capital stock
|
Retained deficit
|
Accumulated other comprehensive income (loss)
1
|
Other
2
|
Total equity attributable to shareholders
|
Non-controlling interests
|
Total equity
|
|
At January 1, 2019
|
1,167,847
|
|
$20,883
|
|
($13,453
|
)
|
($158
|
)
|
$321
|
|
$7,593
|
|
$1,792
|
|
$9,385
|
|
|
Net income
|
—
|
|
—
|
|
305
|
|
—
|
|
—
|
|
305
|
|
58
|
|
363
|
|
|
Total other comprehensive income
|
—
|
|
—
|
|
—
|
|
4
|
|
—
|
|
4
|
|
—
|
|
4
|
|
|
Total comprehensive income
|
—
|
|
—
|
|
305
|
|
4
|
|
—
|
|
309
|
|
58
|
|
367
|
|
|
Transactions with owners
|
|
|
|
|
|
|
|
|
|
Dividends
|
—
|
|
—
|
|
(64
|
)
|
—
|
|
—
|
|
(64
|
)
|
—
|
|
(64
|
)
|
|
Merger with Randgold Resources Limited
|
583,669
|
|
7,903
|
|
—
|
|
—
|
|
—
|
|
7,903
|
|
885
|
|
8,788
|
|
|
Issued on exercise of stock options
|
25
|
|
—
|
|
—
|
|
—
|
|
—
|
|
—
|
|
—
|
|
—
|
|
|
Funding from non-controlling interests
|
—
|
|
—
|
|
—
|
|
—
|
|
—
|
|
—
|
|
14
|
|
14
|
|
|
Other decrease in non-controlling interest
|
—
|
|
—
|
|
—
|
|
—
|
|
—
|
|
—
|
|
(28
|
)
|
(28
|
)
|
|
Dividend reinvestment plan (note 16)
|
1,128
|
|
15
|
|
(15
|
)
|
—
|
|
—
|
|
—
|
|
—
|
|
—
|
|
|
Share-based payments
|
—
|
|
—
|
|
—
|
|
—
|
|
5
|
|
5
|
|
—
|
|
5
|
|
|
Total transactions with owners
|
584,822
|
|
7,918
|
|
(79
|
)
|
—
|
|
5
|
|
7,844
|
|
871
|
|
8,715
|
|
|
At June 30, 2019
|
1,752,669
|
|
$28,801
|
|
($13,227
|
)
|
($154
|
)
|
$326
|
|
$15,746
|
|
$2,721
|
|
$18,467
|
|
|
|
|
|
|
|
|
|
|
|
|
At December 31, 2017
|
1,166,577
|
|
$20,893
|
|
($11,759
|
)
|
($169
|
)
|
$321
|
|
$9,286
|
|
$1,781
|
|
$11,067
|
|
|
Impact of adopting IFRS 15 on January 1, 2018
|
—
|
|
—
|
|
64
|
|
—
|
|
—
|
|
64
|
|
—
|
|
64
|
|
|
At January 1, 2018 (restated)
|
1,166,577
|
|
$20,893
|
|
($11,695
|
)
|
($169
|
)
|
$321
|
|
$9,350
|
|
$1,781
|
|
$11,131
|
|
|
Net income
|
—
|
|
—
|
|
64
|
|
—
|
|
—
|
|
64
|
|
52
|
|
116
|
|
|
Total other comprehensive income
|
—
|
|
—
|
|
—
|
|
5
|
|
—
|
|
5
|
|
—
|
|
5
|
|
|
Total comprehensive income
|
—
|
|
—
|
|
64
|
|
5
|
|
—
|
|
69
|
|
52
|
|
121
|
|
|
Transactions with owners
|
|
|
|
|
|
|
|
|
|
Dividends
|
—
|
|
—
|
|
(63
|
)
|
—
|
|
—
|
|
(63
|
)
|
—
|
|
(63
|
)
|
|
Issued on exercise of stock options
|
11
|
|
—
|
|
—
|
|
—
|
|
—
|
|
—
|
|
—
|
|
—
|
|
|
Funding from non-controlling interests
|
—
|
|
—
|
|
—
|
|
—
|
|
—
|
|
—
|
|
12
|
|
12
|
|
|
Other decrease in non-controlling interests
|
—
|
|
—
|
|
—
|
|
—
|
|
—
|
|
—
|
|
(95
|
)
|
(95
|
)
|
|
Dividend reinvestment plan
|
571
|
|
7
|
|
(7
|
)
|
—
|
|
—
|
|
—
|
|
—
|
|
—
|
|
|
Total transactions with owners
|
582
|
|
7
|
|
(70
|
)
|
—
|
|
—
|
|
(63
|
)
|
(83
|
)
|
(146
|
)
|
|
At June 30, 2018
|
1,167,159
|
|
$20,900
|
|
($11,701
|
)
|
($164
|
)
|
$321
|
|
$9,356
|
|
$1,750
|
|
$11,106
|
|
-
1
Includes cumulative translation losses at June 30, 2019: $85 million (June 30, 2018: $72 million).
-
2
Includes additional paid-in capital as at June 30, 2019: $283 million (December 31, 2018: $283 million; June 30, 2018: $283 million) and convertible borrowings - equity component as at June 30, 2019: $38 million (December 31, 2018: $38 million; June 30, 2018: $38 million).
The notes to these unaudited condensed interim financial statements, which are contained in the Second Quarter Report 2019 available on our website are an integral part of these consolidated financial statements.
Corporate Office
Barrick Gold Corporation
161 Bay Street, Suite 3700
Toronto, Ontario M5J 2S1
Canada
Telephone: +1 416 861-9911
Email: investor@barrick.com
Website: www.barrick.com
Shares Listed
GOLD
The New York Stock Exchange
ABX
The Toronto Stock Exchange
Transfer Agents and Registrars
AST Trust Company (Canada)
P.O. Box 700, Postal Station B
Montreal, Quebec H3B 3K3
or
American Stock Transfer & Trust Company, LLC
6201 – 15 Avenue
Brooklyn, New York 11219
Telephone: 1-800-387-0825
Fax: 1-888-249-6189
Email: inquiries@astfinancial.com
Website: www.astfinancial.com
Enquiries
President and Chief Executive Officer
Mark Bristow
+1 647 205 7694
+44 788 071 1386
Senior Executive Vice-President and
Chief Financial Officer
Graham Shuttleworth
+1 647 262 2095
+44 1534 735 333
Investor and Media Relations
Kathy du Plessis
+44 20 7557 7738
Email: barrick@dpapr.com
Cautionary Statement on Forward-Looking Information
Certain information contained or incorporated by reference in this press release, including any information as to our strategy, projects, plans or future financial or operating performance, constitutes “forward-looking statements”. All statements, other than statements of historical fact, are forward-looking statements. The words “future”, “commitment”, “potential”, “development”, “possible”, “initiative”, “opportunities”, “continue”, “look forward”, “shall”, “will”, “should” and similar expressions identify forward-looking statements. In particular, this press release contains forward-looking statements including, without limitation, with respect to: the future for Porgera, including opportunities to maintain and increase production while continuing to reduce costs, and continued benefits to the country and community; and discussions to reach agreement with the PNG government regarding an extension of Porgera’s special mining lease and the terms of any such agreement.
Forward-looking statements are necessarily based upon a number of estimates and assumptions including material estimates and assumptions related to the factors set forth below that, while considered reasonable by the Company as at the date of this press release in light of management’s experience and perception of current conditions and expected developments, are inherently subject to significant business, economic and competitive uncertainties and contingencies. Known and unknown factors could cause actual results to differ materially from those projected in the forward-looking statements and undue reliance should not be placed on such statements and information. Such factors include, but are not limited to: timing of receipt of, or failure to comply with, necessary permits and approvals, including with respect to Barrick Niugini Limited’s application for an extension to the Porgera mine’s special mining lease; changes in national and local government legislation, taxation, controls or regulations and/or changes in the administration of laws, policies and practices, expropriation or nationalization of property and political or economic developments in PNG; lack of certainty with respect to foreign legal systems, corruption and other factors that are inconsistent with the rule of law; risks associated with illegal and artisanal mining; fluctuations in the spot and forward price of gold, copper or certain other commodities (such as silver, diesel fuel, natural gas and electricity); the speculative nature of mineral exploration and development; changes in mineral production performance, exploitation and exploration successes; risks associated with projects in the early stages of evaluation and for which additional engineering and other analysis is required; diminishing quantities or grades of reserves; increased costs, delays, suspensions and technical challenges associated with the construction of capital projects; operating or technical difficulties in connection with mining or development activities, including geotechnical challenges and disruptions in the maintenance or provision of required infrastructure and information technology systems; failure to comply with environmental and health and safety laws and regulations; uncertainty whether some or all of Barrick's targeted investments and projects will meet the Company’s capital allocation objectives and internal hurdle rate; the impact of global liquidity and credit availability on the timing of cash flows and the values of assets and liabilities based on projected future cash flows; adverse changes in our credit ratings; the impact of inflation; fluctuations in the currency markets; changes in U.S. dollar interest rates; disruption of supply routes which may cause delays in construction and mining activities; damage to the Company’s reputation due to the actual or perceived occurrence of any number of events, including negative publicity with respect to the Company’s handling of environmental matters or dealings with community groups, whether true or not; the possibility that future exploration results will not be consistent with the Company’s expectations; risks that exploration data may be incomplete and considerable additional work may be required to complete further evaluation, including but not limited to drilling, engineering and socioeconomic studies and investment; risk of loss due to acts of war, terrorism, sabotage and civil disturbances; litigation and legal and administrative proceedings; contests over title to properties, particularly title to undeveloped properties, or over access to water, power and other required infrastructure; business opportunities that may be presented to, or pursued by, the Company; our ability to successfully integrate acquisitions or complete divestitures; risks associated with working with partners in jointly controlled assets; employee relations including loss of key employees; increased costs and physical risks, including extreme weather events and resource shortages, related to climate change; and availability and increased costs associated with mining inputs and labor. In addition, there are risks and hazards associated with the business of mineral exploration, development and mining, including environmental hazards, industrial accidents, unusual or unexpected formations, pressures, cave-ins, flooding and gold bullion, copper cathode or gold or copper concentrate losses (and the risk of inadequate insurance, or inability to obtain insurance, to cover these risks).
Many of these uncertainties and contingencies can affect our actual results and could cause actual results to differ materially from those expressed or implied in any forward-looking statements made by, or on behalf of, us. Readers are cautioned that forward-looking statements are not guarantees of future performance. All of the forward-looking statements made in this press release are qualified by these cautionary statements. Specific reference is made to the most recent Form 40-F/Annual Information Form on file with the SEC and Canadian provincial securities regulatory authorities for a more detailed discussion of some of the factors underlying forward-looking statements and the risks that may affect Barrick’s ability to achieve the expectations set forth in the forward-looking statements contained in this press release. We disclaim any intention or obligation to update or revise any forward-looking statements whether as a result of new information, future events or otherwise, except as required by applicable law.